We initiate coverage of Dubai Islamic Bank, the world's first full-service Islamic bank and the UAE's largest, with an Equal-Weight rating and a fair value of AED 7.98 per share, implying 9.2% upside to the last close of AED 7.31 and a total return of roughly 14% including the dividend. Our blended fair value averages four methods: justified price-to-tangible-book (AED 8.37), dividend discount (AED 6.40), trading comparables (AED 8.29) and DIB's own trading history (AED 8.87). [Analyst note: emphasize the dividend lever in the summary.]
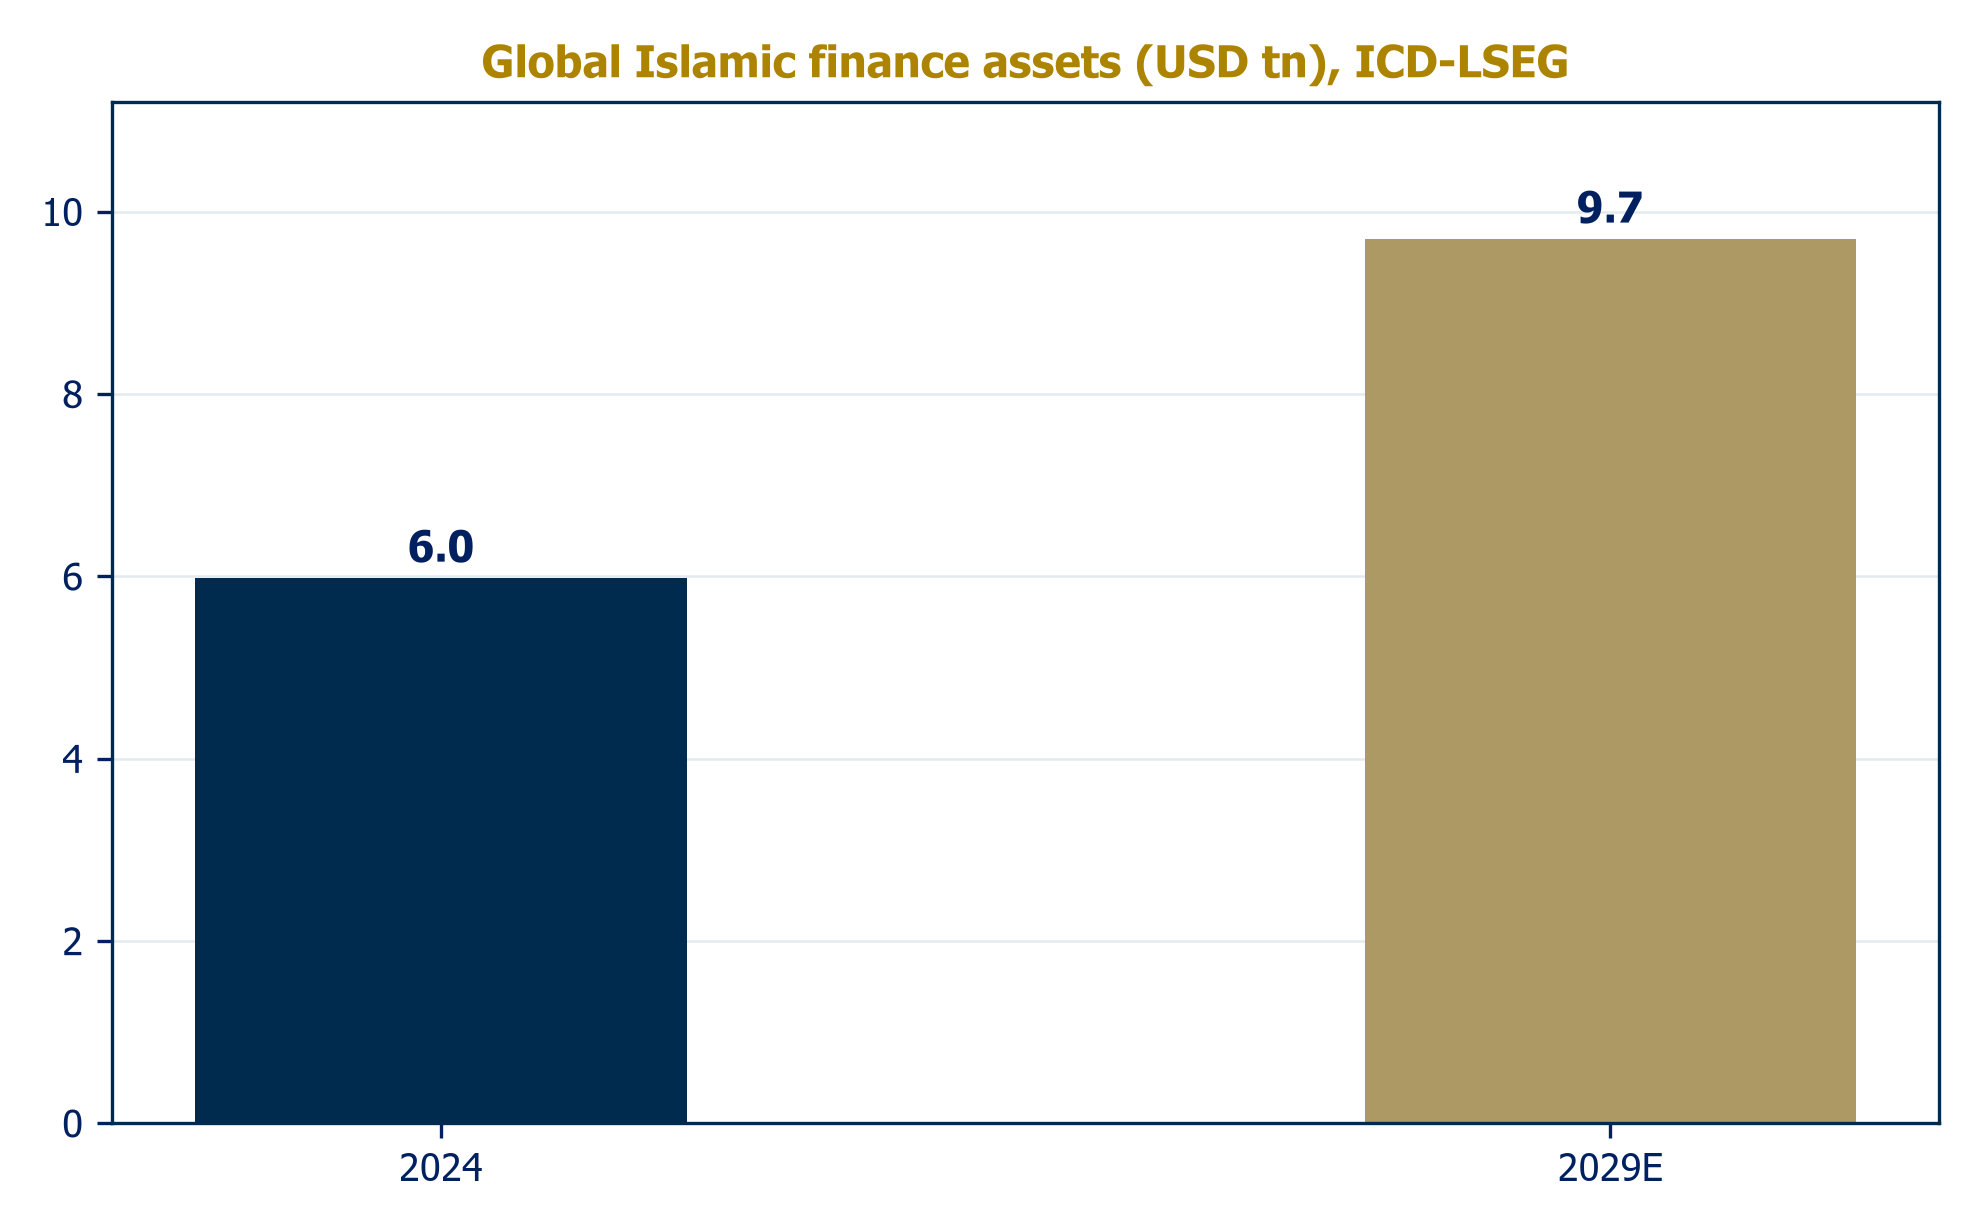
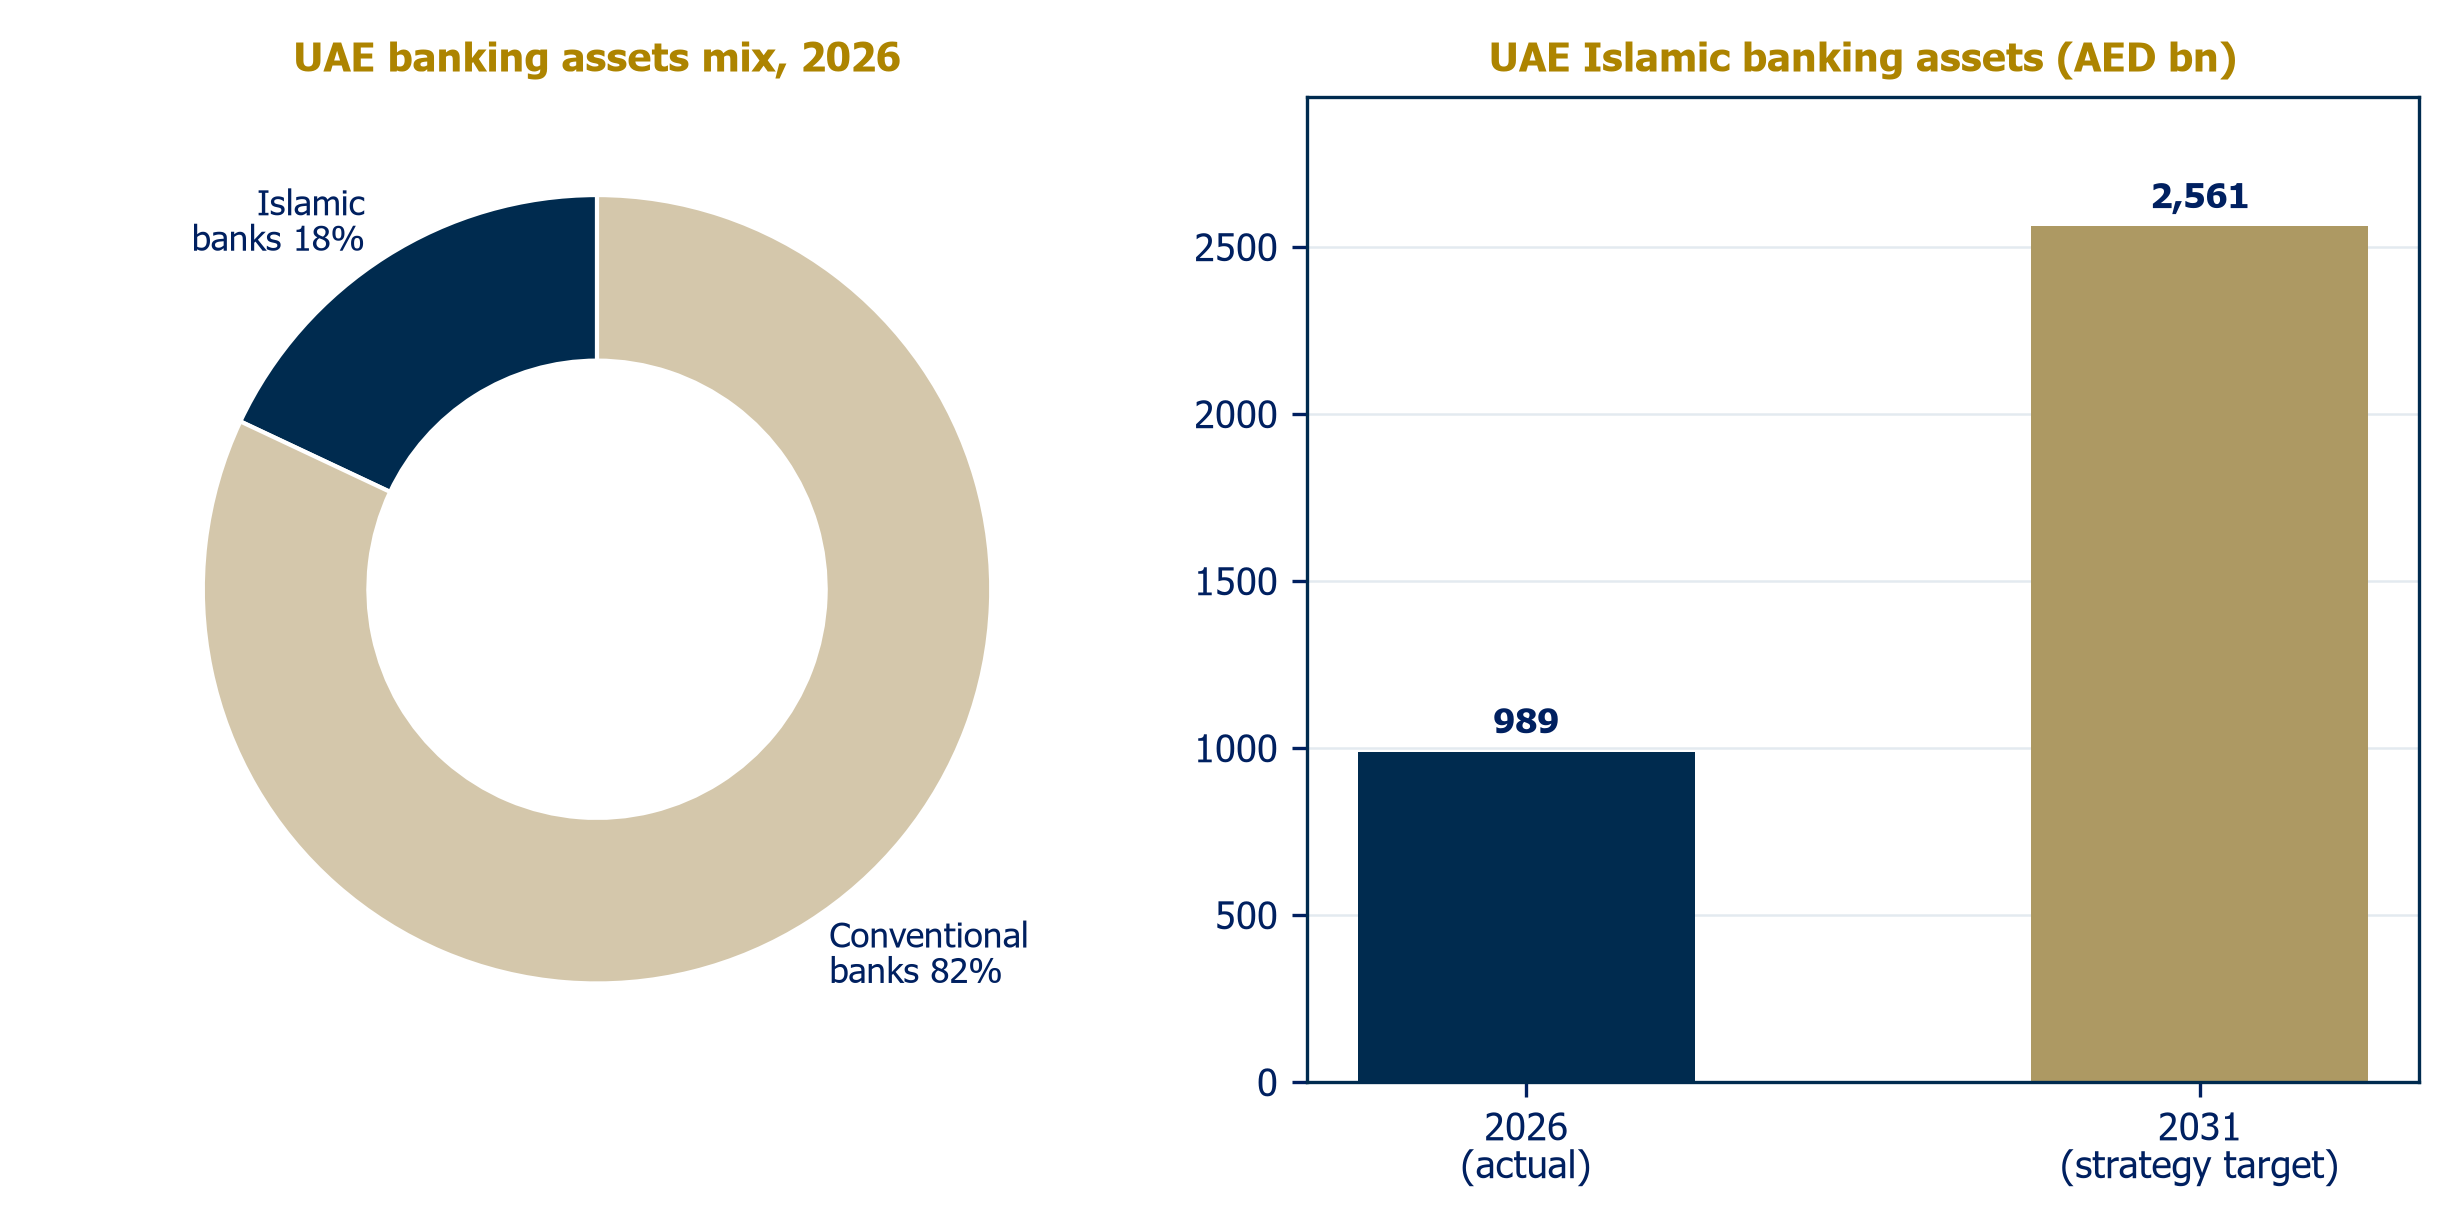
Islamic finance is on a roll, again. Global industry assets reached USD 5.98 trillion in 2024 and are projected toward USD 9.7 trillion by 2029. At home, the UAE has turned intent into policy: the national Islamic finance strategy approved in May 2025 targets AED 2.56 trillion of Islamic banking assets by 2031, more than 2.5 times today's pool. DIB, holding roughly two-fifths of the UAE's listed Islamic banking assets, is the single largest beneficiary of that tailwind.
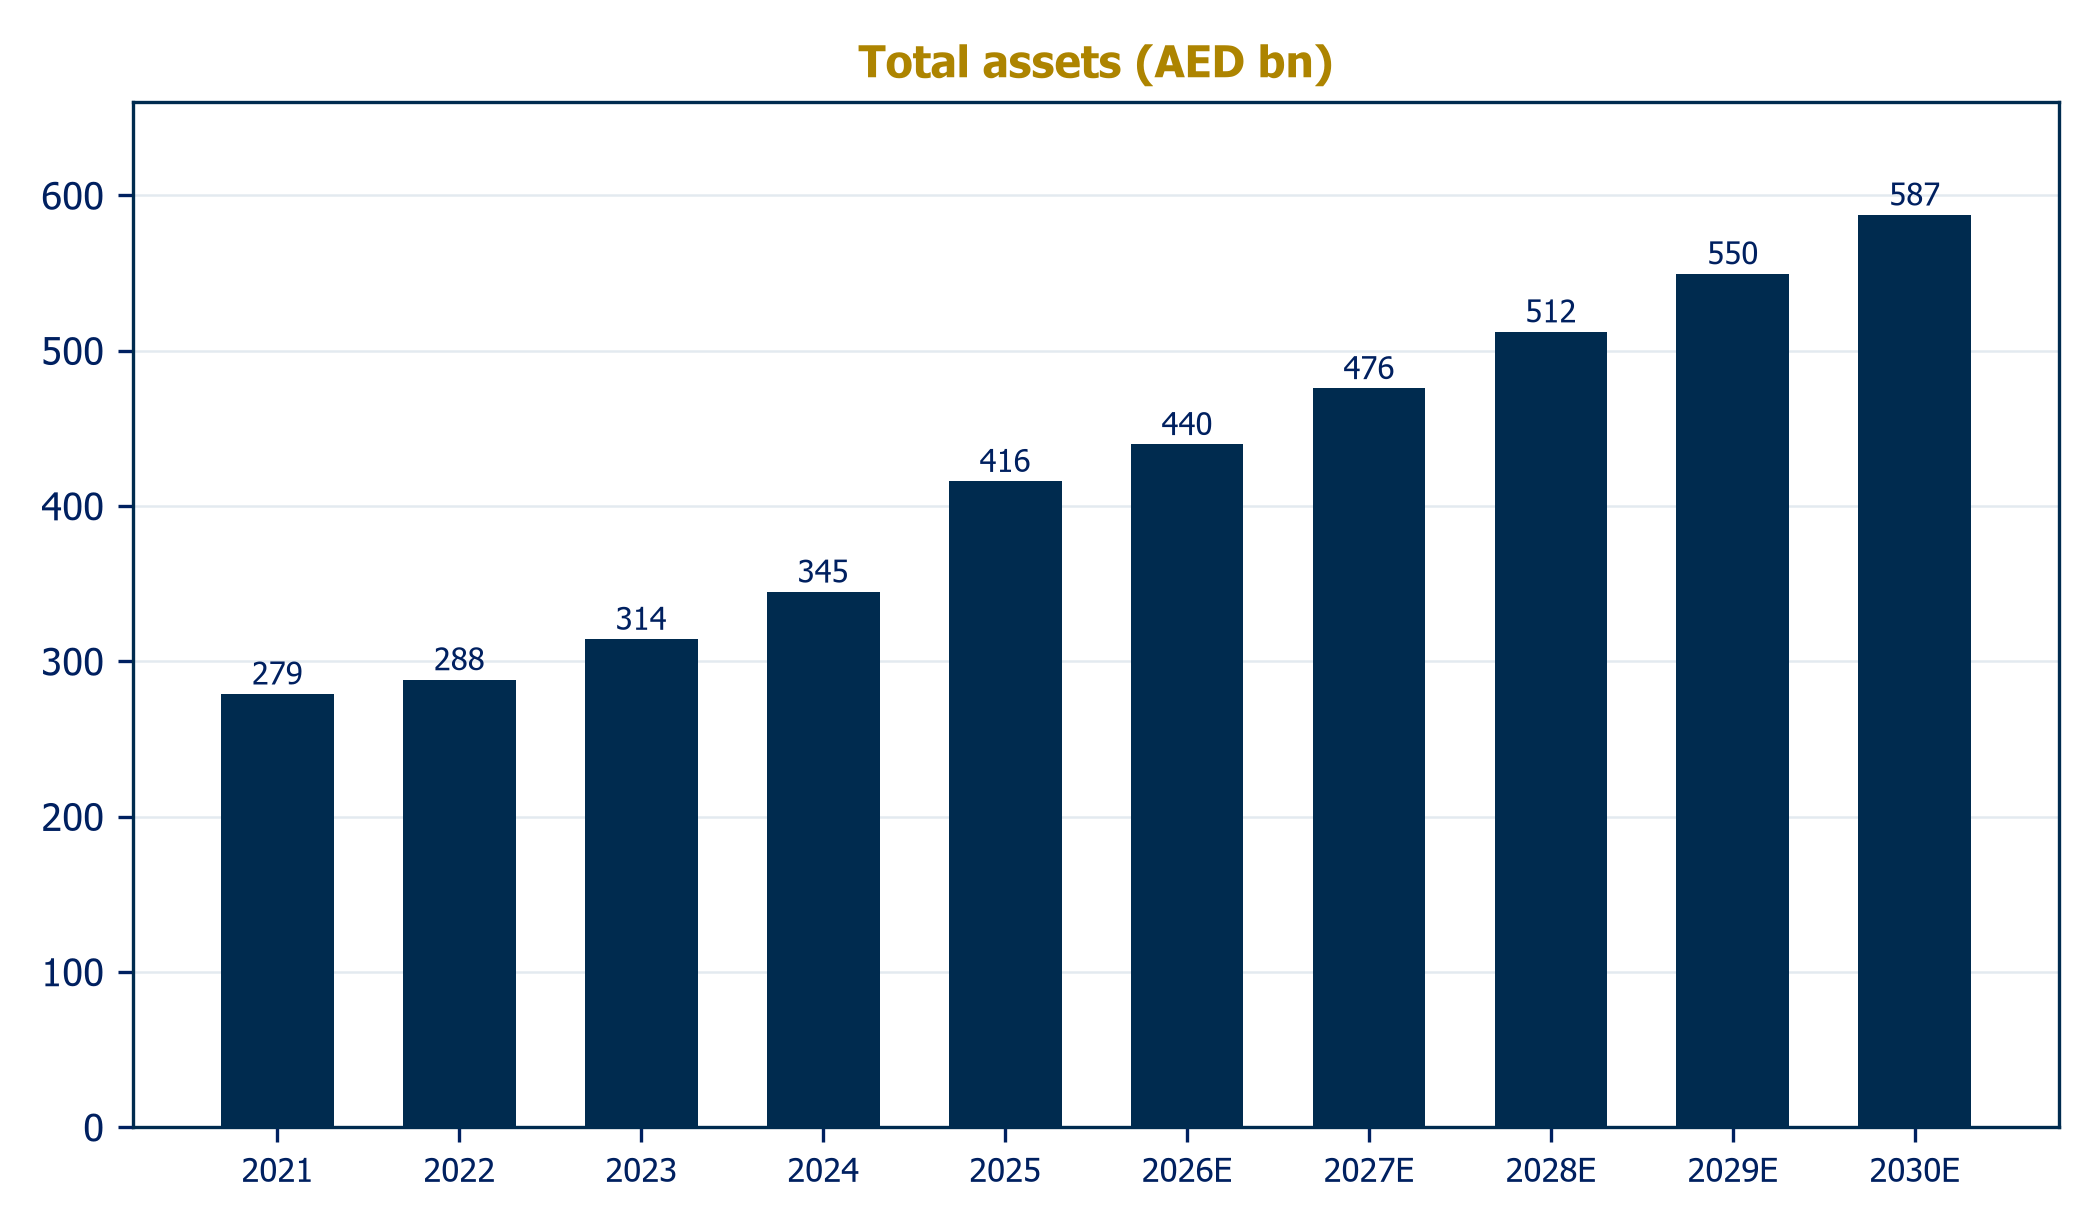
The franchise delivered a record 2025. Total assets grew 21% to AED 416 billion, deposits rose 29%, AED 124 billion of new financing was originated, and pre-tax profit reached AED 9.0 billion, up 20% on a normalized basis. Asset quality is the best in a decade: the NPF ratio fell from 4.0% to 2.65% and reached 2.4% by June 2026.
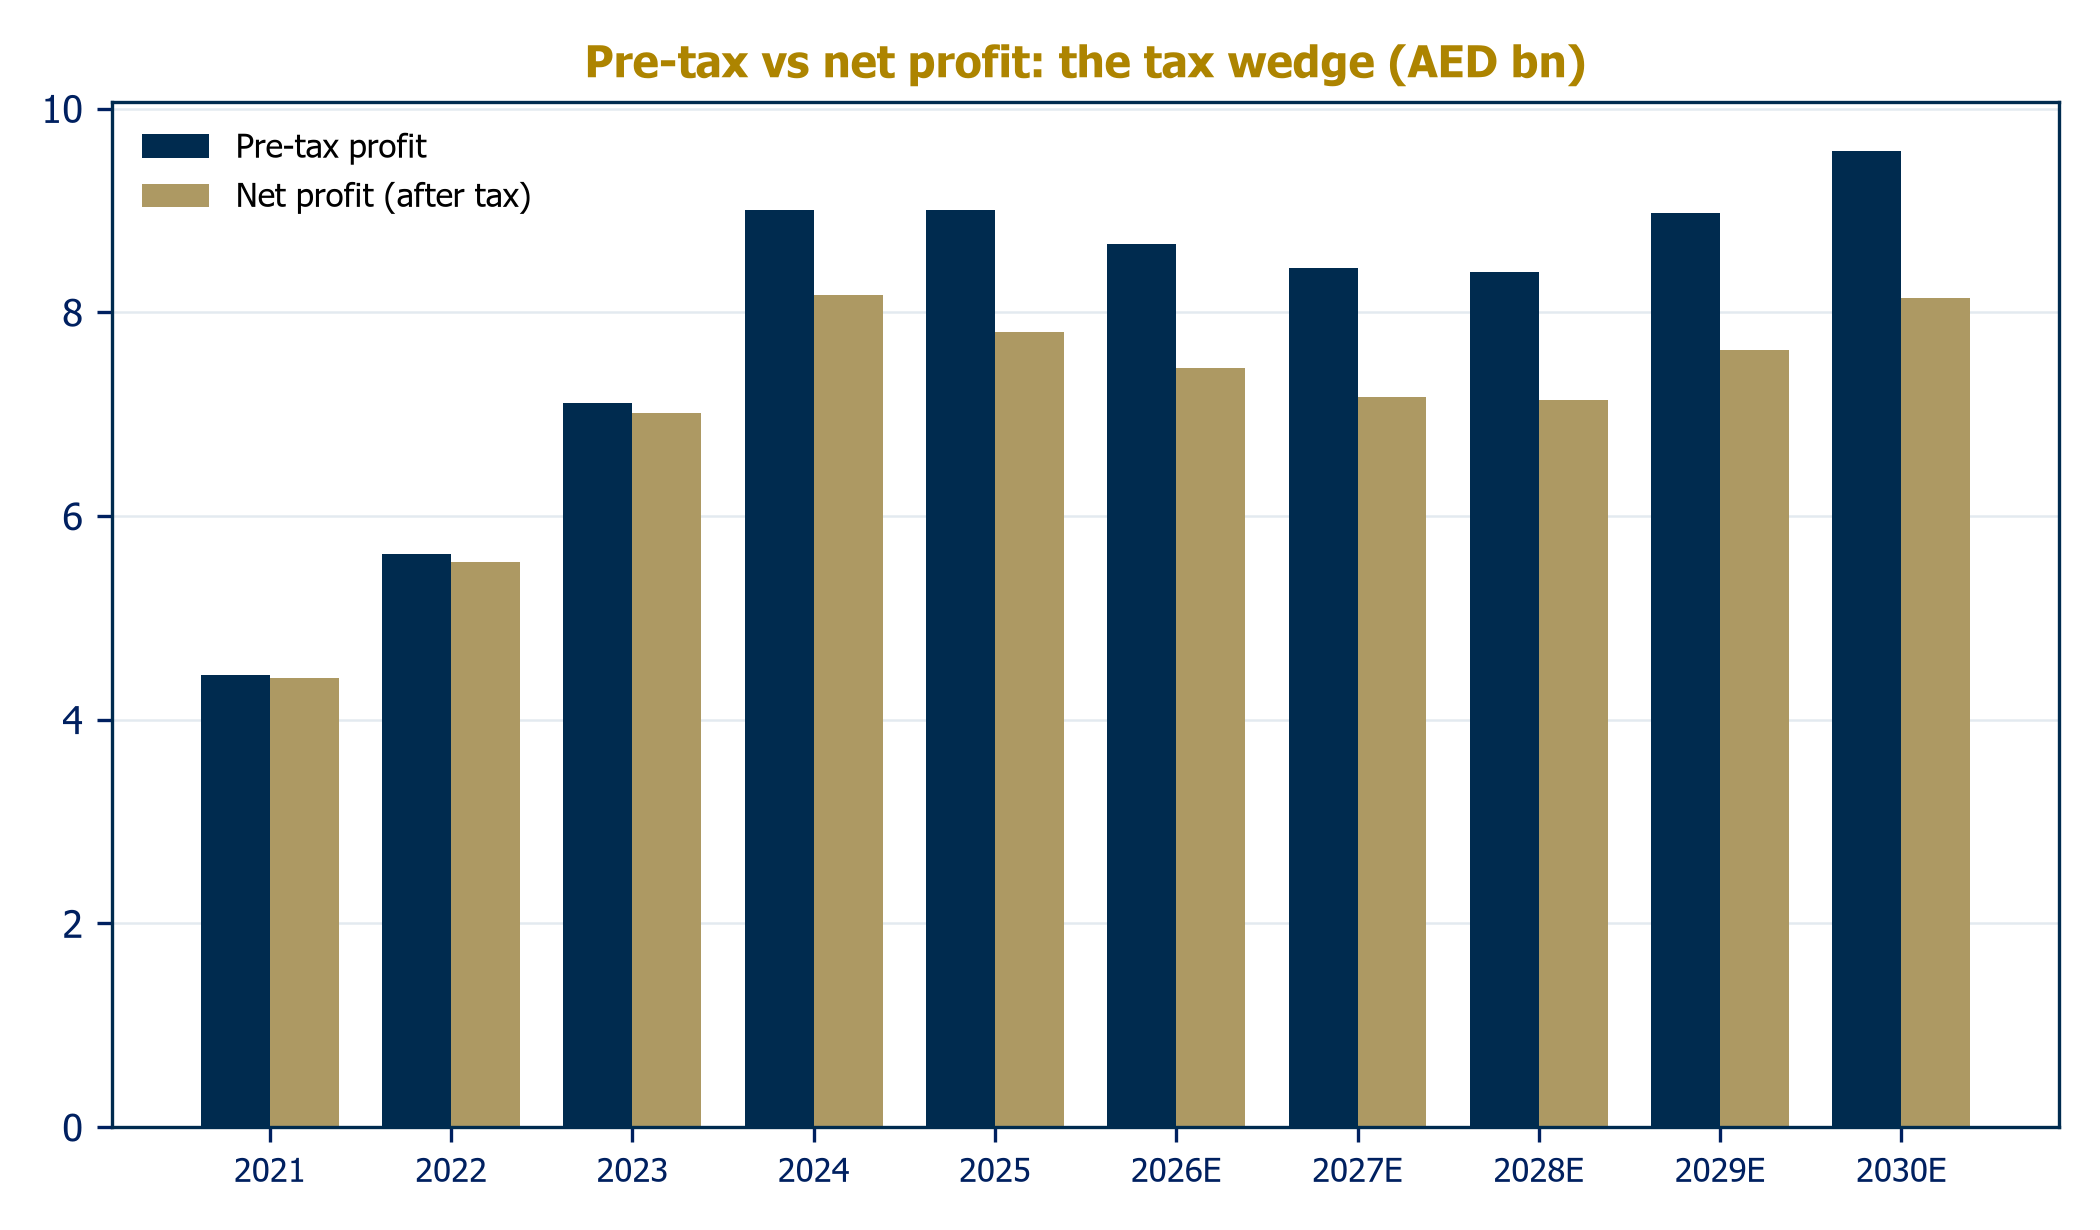
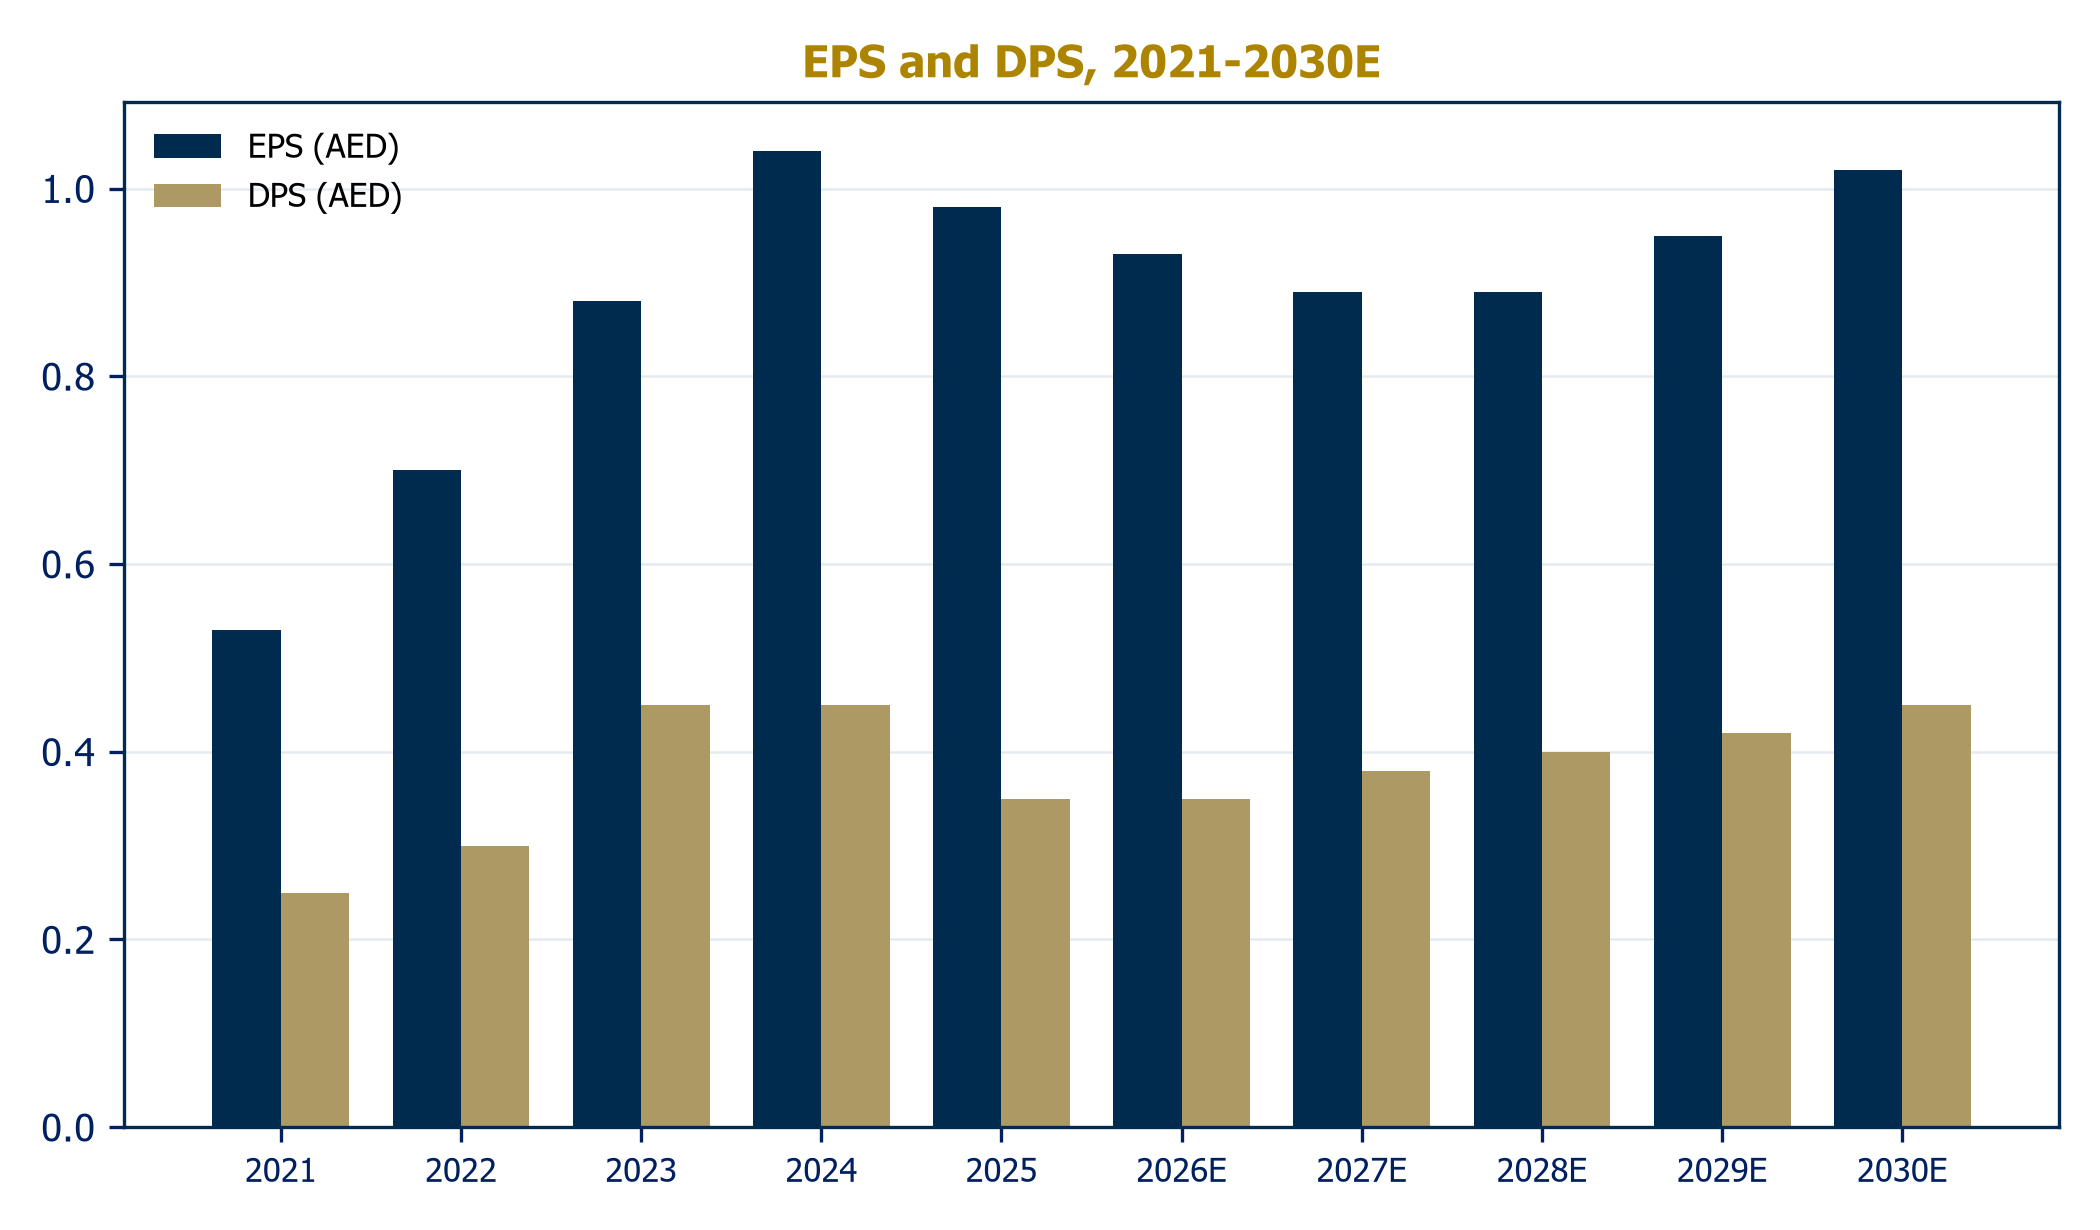
But the earnings math has changed. UAE corporate tax plus the Pillar Two top-up turned 20% pre-tax growth into broadly flat net profit; the FY2025 dividend was cut to 35 fils from 45; and our base case sees margins compressing toward management's 2.3% guidance as the Fed cycle transmits through the dirham peg while cost of risk normalizes from an unsustainable 14bps toward 45bps. On our numbers EPS troughs near AED 0.89 in 2027-2028 before recovering to AED 1.02 by 2030.
The stock has de-rated far beyond that math. DIB is down 25.6% over twelve months against ADIB up 9.5%, and trades at 7.4x trailing earnings and roughly 1.0x book against ADIB's 13.1x and 2.66x. We think the discount now overstates the fade: the franchise, the state alignment, and the sector's policy tailwind are intact, and two levers, payout normalization and a visible margin floor, would each move fair value materially. At +9.2% upside we are constructive but not yet compelled; the sensitivity work in this report maps exactly which beliefs would change the rating.
| Stock Rating | |
| Current Rating | Equal-Weight |
| Fair Value | 7.98 |
| Former Rating | Not rated |
| Target Upside | +9.2% |
| Listing / Sector | Dubai / Banking |
| Bloomberg / Reuters | DIB UH / DISB.DU |
Half a century after Dubai Islamic Bank invented the industry, Islamic finance is compounding at a pace conventional banking cannot match, and DIB's home regulator has now made expanding it official state policy.
Global Islamic finance assets reached USD 5.98 trillion in 2024, up 21% year on year, and ICD-LSEG projects the industry to reach USD 9.7 trillion by 2029, roughly 10% average annual growth. S&P counts the industry above USD 5 trillion, estimates 10.2% growth in 2025, and projects 5-10% for 2026, with regional geopolitics the key swing factor. Islamic banking is the industry's core at about 72% of assets across 84 markets.
Sukuk outstanding passed USD 1 trillion in 2024-2025. Issuance ran at USD 265-300 billion in 2025, and S&P forecasts USD 270-280 billion for 2026, supported by Fed easing, GCC financing needs and refinancing walls. Credit quality has been remarkable: 82.5% of Fitch-rated sukuk are investment grade and the market has seen no defaults in four years. For DIB this market is a double franchise, as the GCC's most prolific Islamic bank issuer and as a leading arranger, with leadership in the fastest-growing ESG sub-segment.
The UAE operates the largest banking system in the Middle East, with assets of AED 5.57 trillion as of April 2026 after 17% growth in 2025. Within it, Islamic banks hold approximately AED 989 billion of assets, an 18% share stable for five years. The UAE National Strategy for Islamic Finance targets AED 2.56 trillion by 2031, more than 2.5 times the current pool. The benchmark set is instructive: Islamic banking holds 76% of banking assets in Saudi Arabia and about half in Kuwait, against 18% in the UAE.
The dirham peg makes DIB's margin outlook a function of US policy. The Fed cut three times in 2025 to 3.50-3.75%, its December projections implied one further cut in 2026, and markets price roughly two; UAE top-10 bank net interest margins compressed 9bps in Q1 2026 to 2.37%. The offset is volume: system credit is growing at the fastest pace in the Gulf. DIB's own guidance, a 2.3% net profit margin for 2026 versus 3.0% in 2024, quantifies the squeeze honestly.
Consensus puts UAE GDP growth at 4.8-5.0% for 2026, driven by a non-oil economy now 79% of output. The one soft patch matters to DIB specifically: Dubai residential transactions cooled roughly 16% by value in H1 2026 and price growth is forecast to moderate to 5-8%. That is a normalization, not a correction, but DIB's collateral base and property adjacencies make the trajectory worth watching.
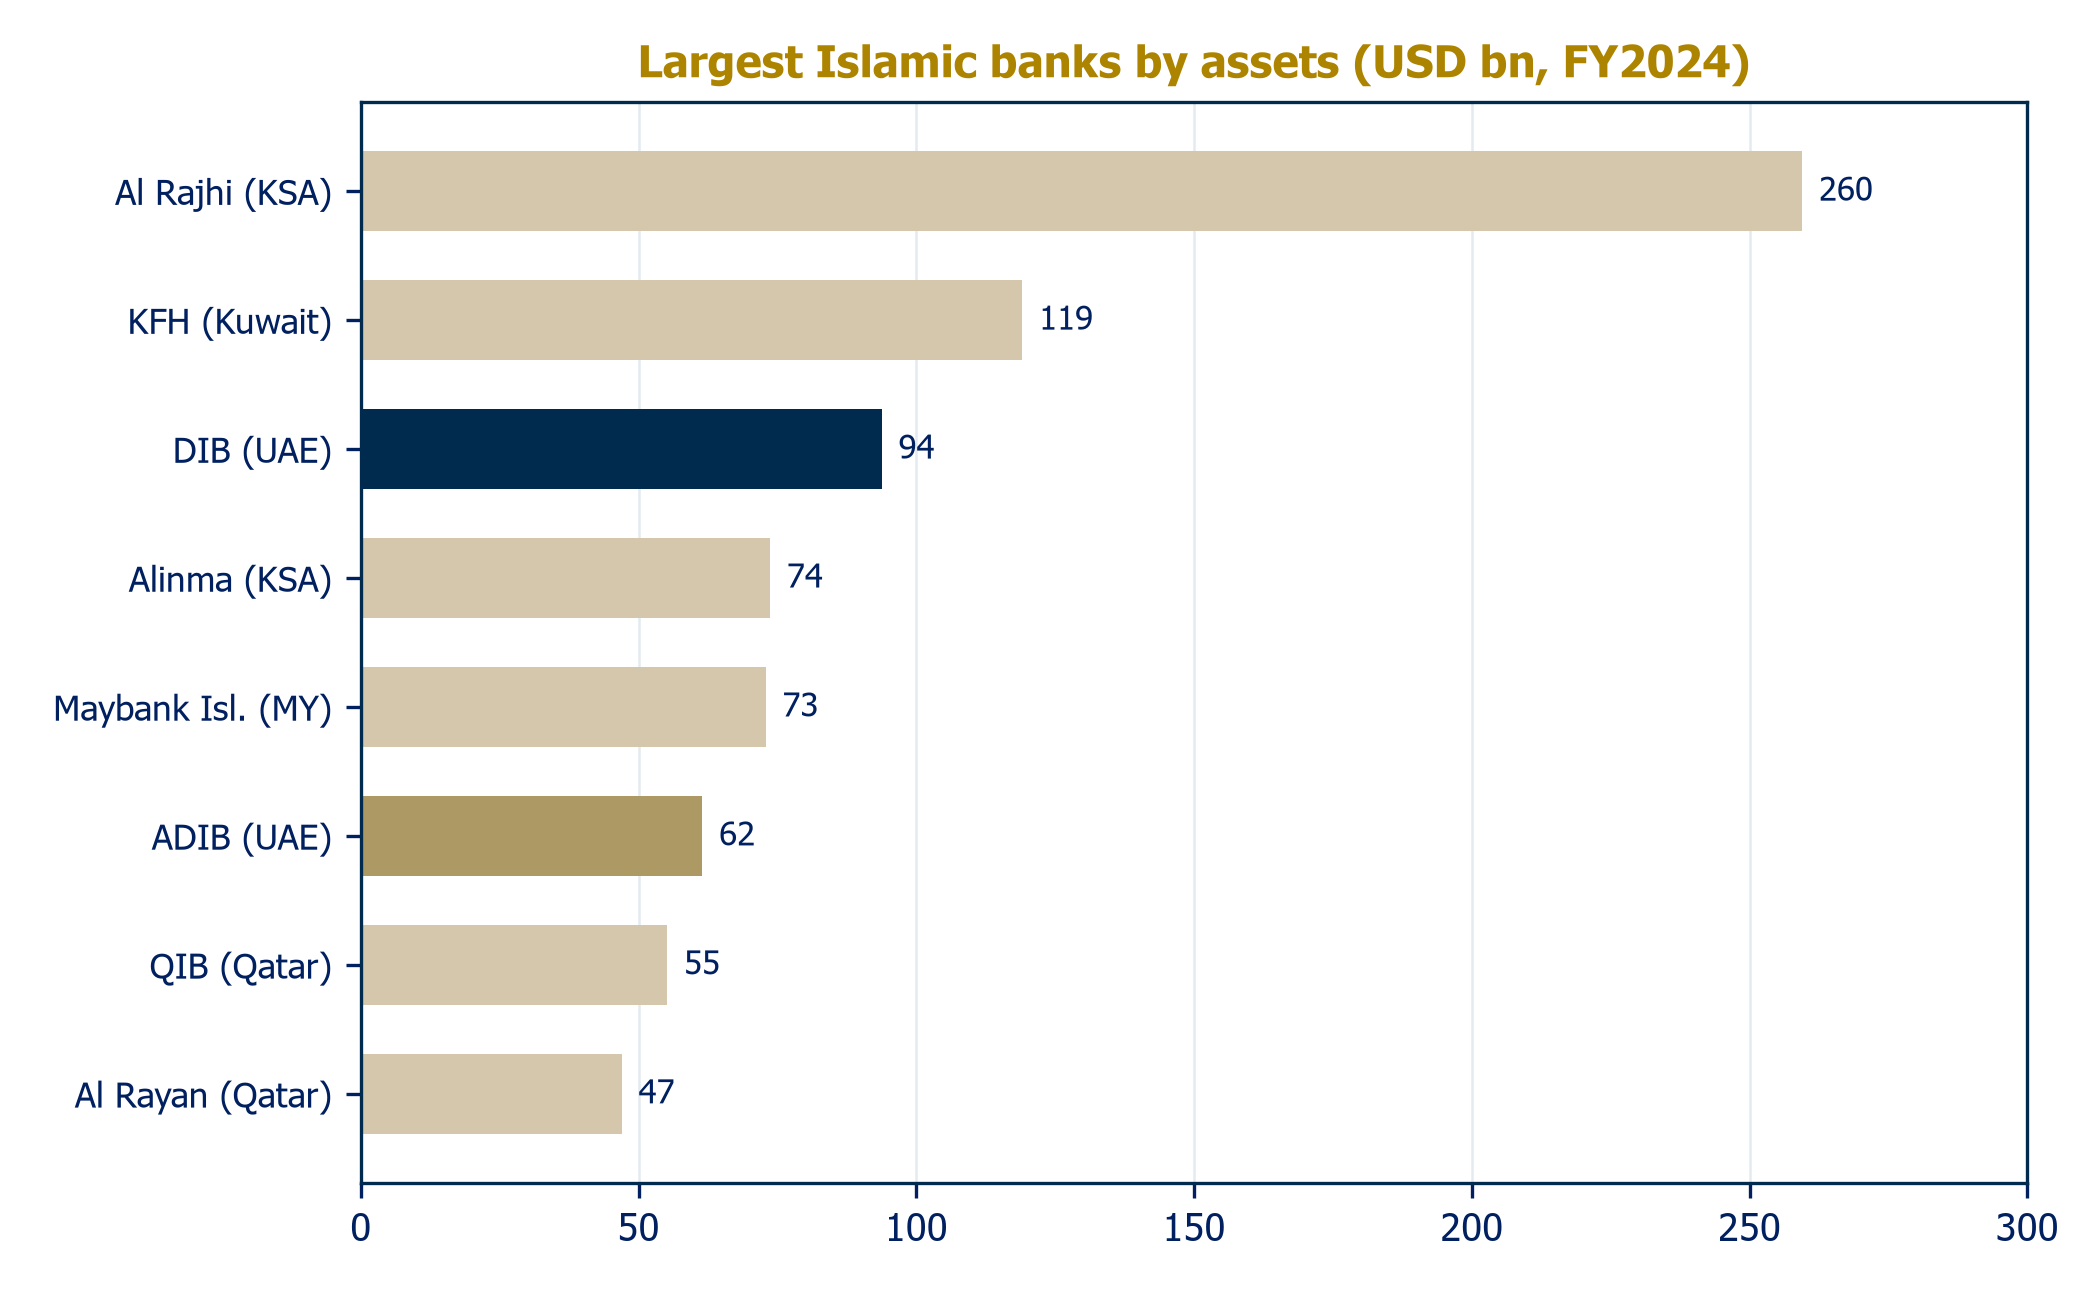
Dubai Islamic Bank is the world's first full-service Islamic bank, founded in 1975, today the largest Islamic bank in the UAE and the third largest globally by assets. The group spans consumer banking, corporate banking, treasury and real estate, with operations in seven countries, more than 500 branches group-wide, over 12,000 employees, and at least five million customers. At end-June 2026: total assets of AED 423 billion, net financing of AED 281 billion, customer deposits of AED 327 billion. Ratings: A3 stable (Moody's), A stable (Fitch), the latter resting explicitly on expected Government of Dubai support.
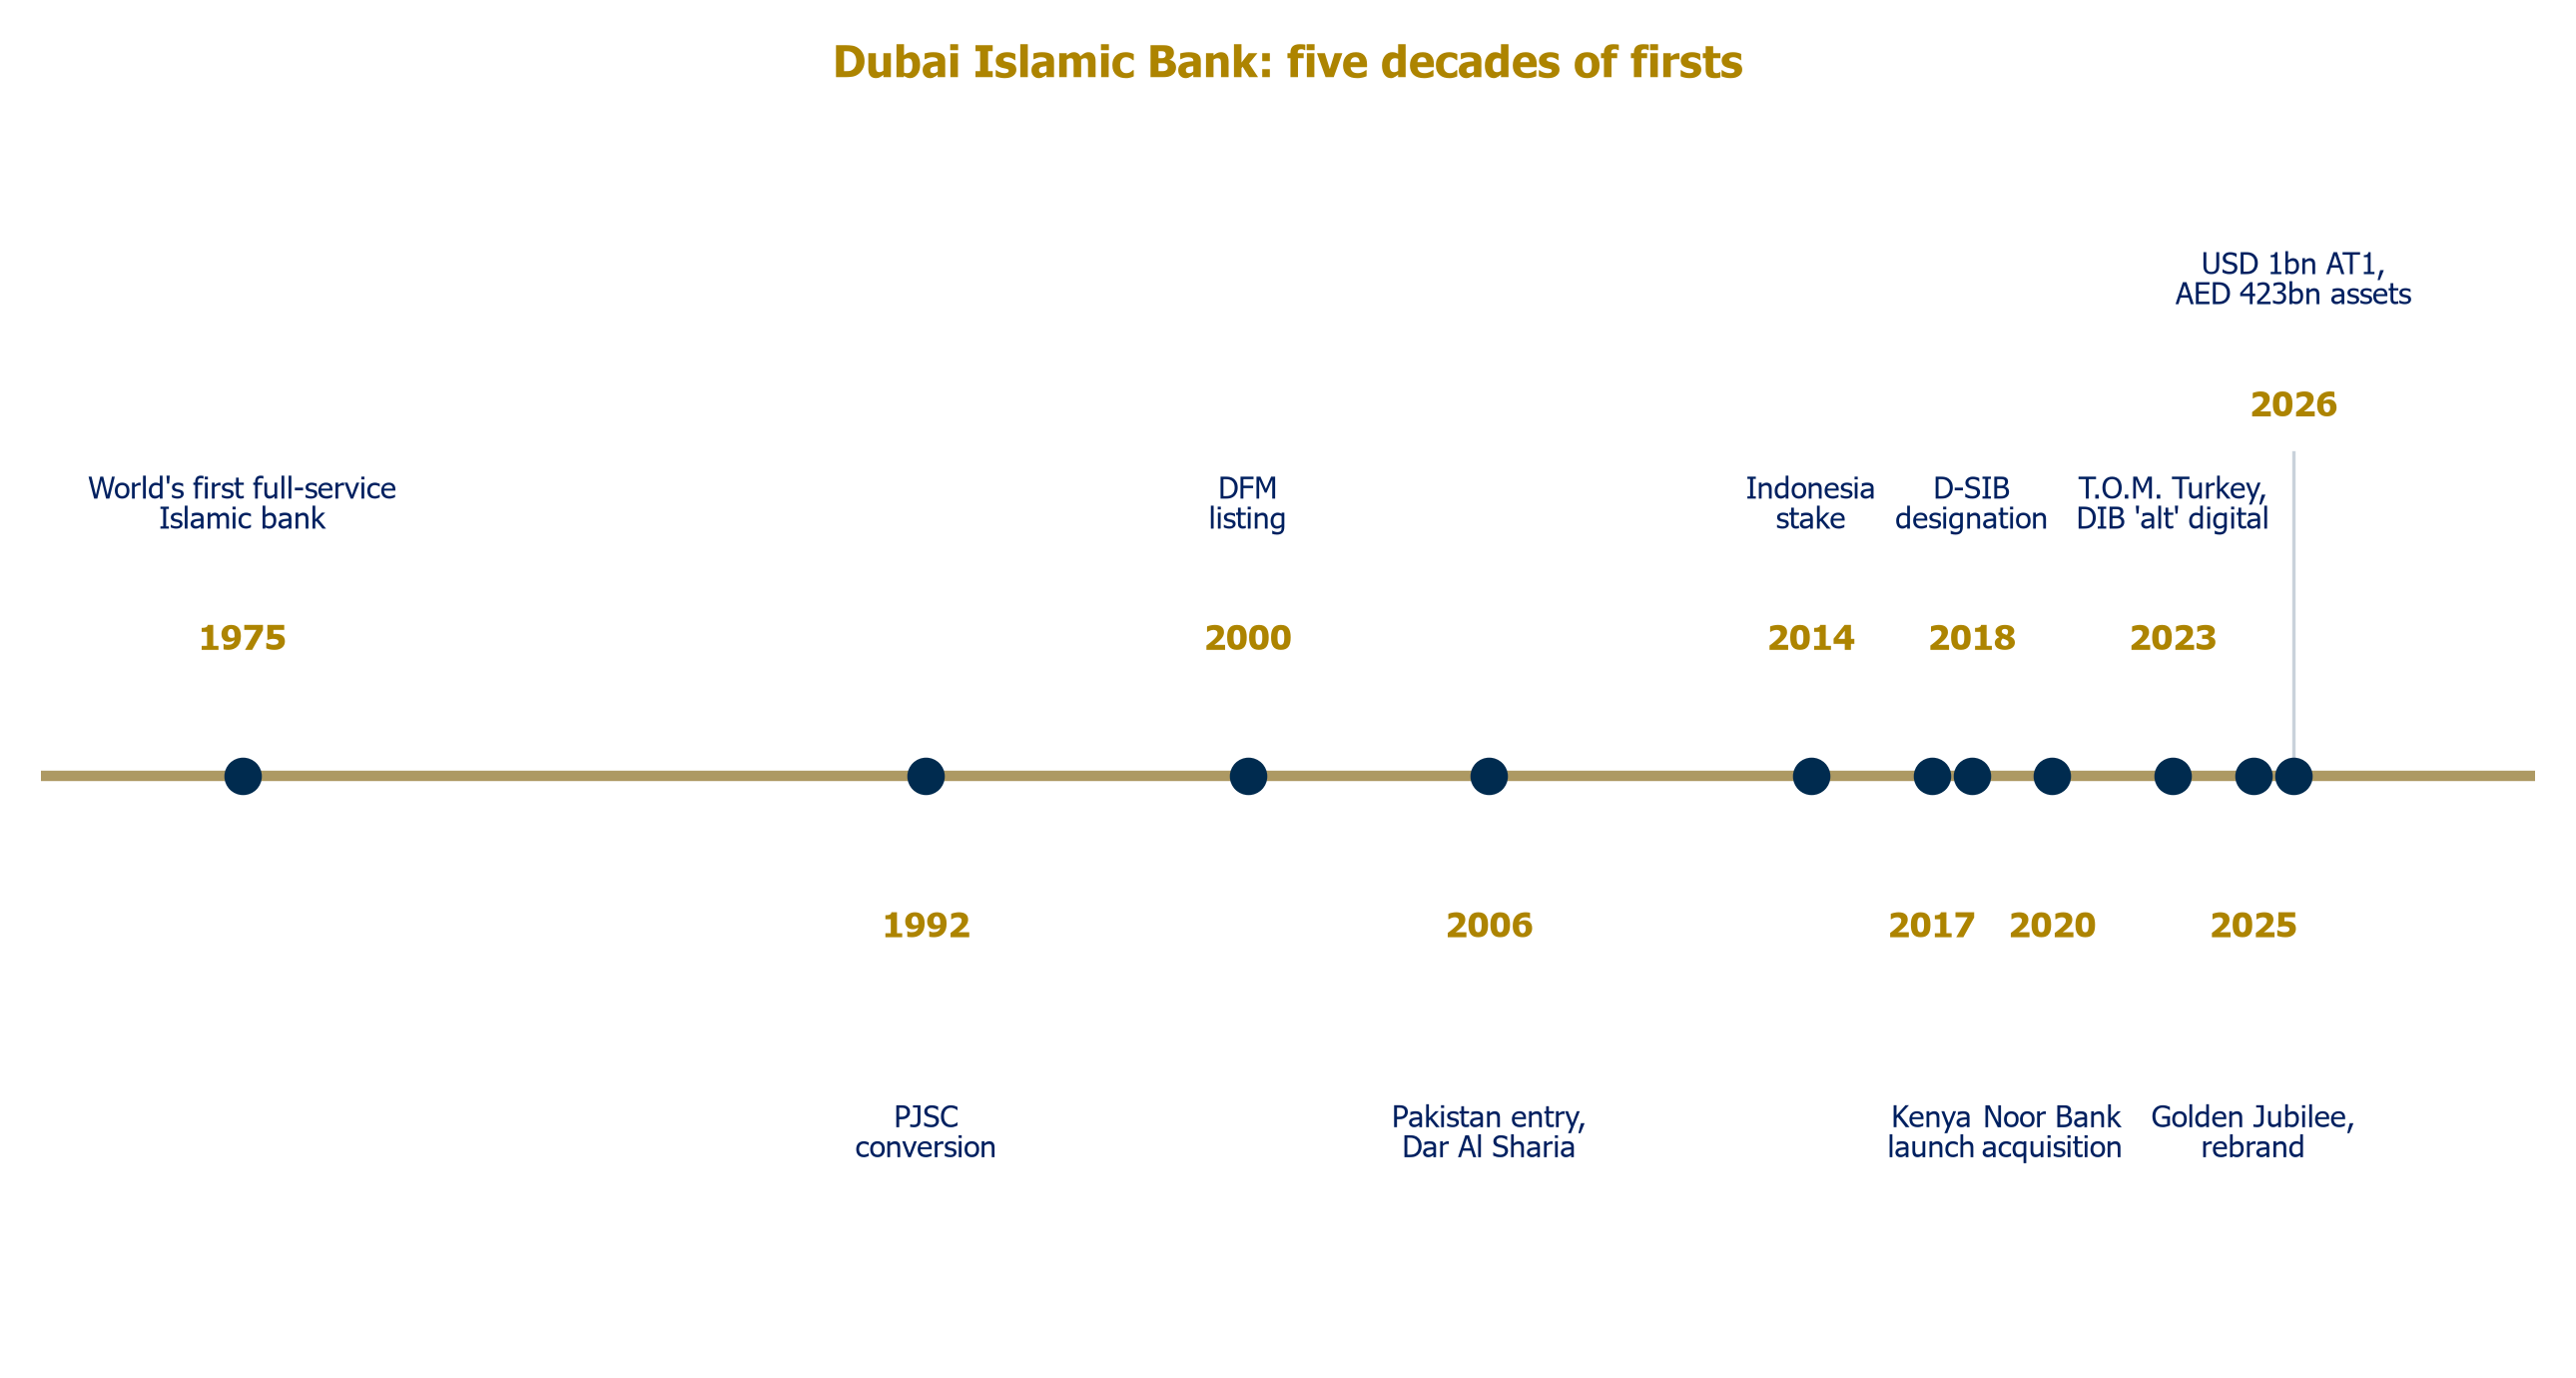
A decree issued by H.H. Sheikh Rashid bin Saeed Al Maktoum in March 1975 authorized the establishment of the bank, founded by Saeed bin Ahmed Lootah, and it opened that September as the first institution anywhere to deliver complete commercial banking in full Sharia compliance. The subsequent arc: Sharia board 1989, PJSC 1992, DFM listing 2000, international expansion to Pakistan (2006), Indonesia (2014), Kenya (2017), D-SIB designation 2018, and the transformational Noor Bank acquisition completed January 2020 and integrated in a record 283 days. The 2020s added sustainable-finance leadership (a debut USD 1 billion sustainability-linked sukuk in November 2025 at the bank's tightest-ever spread), digital optionality (rabbit, DIB 'alt', 25% of Turkey's T.O.M. Group), and 2025 as the strongest growth year in the bank's history, marked by the Golden Jubilee rebrand 'Progress Never Stops'.
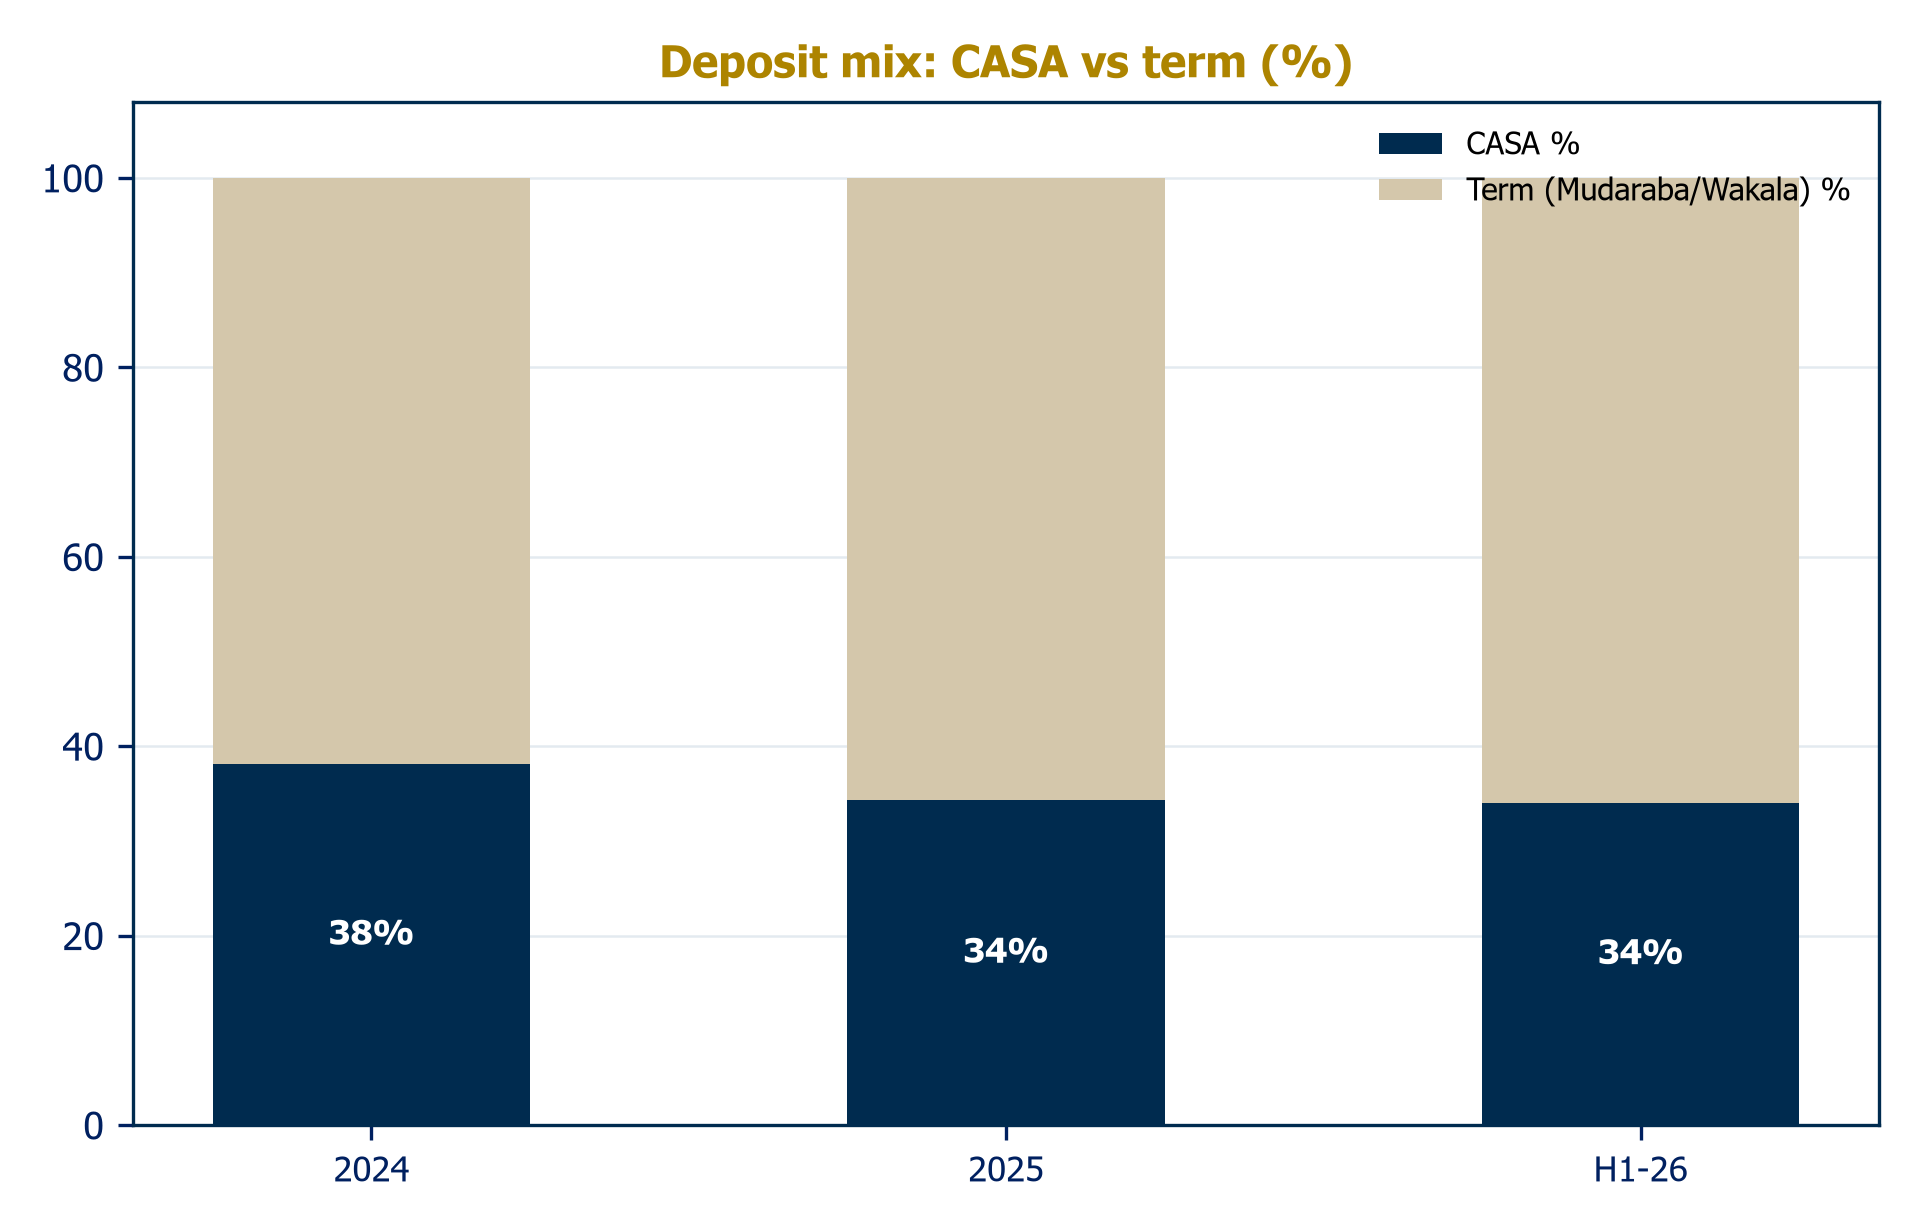
Consumer banking anchors the funding base: accounts, cards, personal, auto and home finance, the XTRA proposition, and Wajaha wealth. CASA stood at 38.1% of deposits at end-2024 and 34% by mid-2026, the decline itself a symptom of the rate cycle that should partially reverse as rates fall. Corporate banking originated the bulk of 2025's AED 124 billion of new financing. Treasury manages a sukuk portfolio of AED 85-91 billion. Digitally, 97% of transactions are processed digitally, and an AI partnership with HCLTech was signed at GITEX in October 2025.
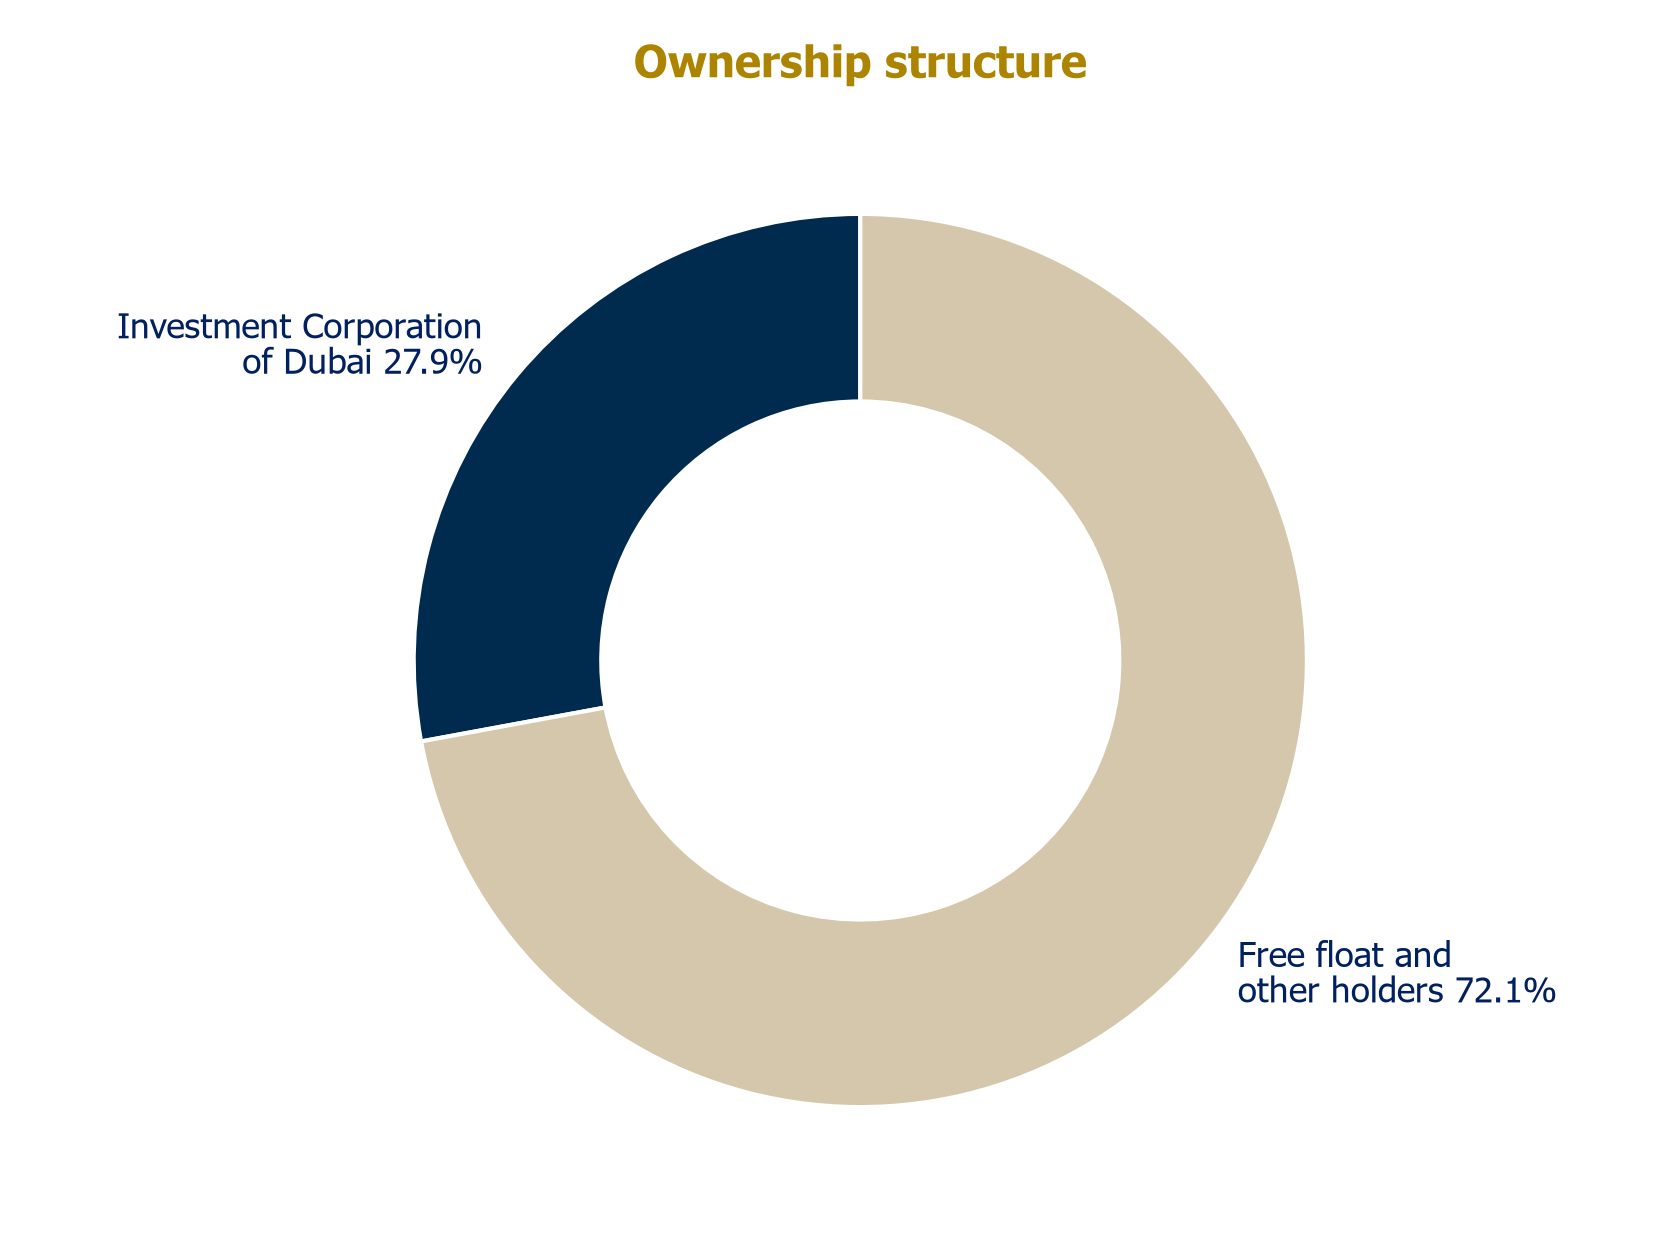
The Government of Dubai anchors the register through the Investment Corporation of Dubai, holding approximately 27.9%; DIB's chairman, H.E. Mohammed Ibrahim Al Shaibani, is simultaneously Director General of the Dubai Ruler's Court and Managing Director of ICD. Sharia oversight rests with an Internal Sharia Supervision Committee of internationally recognized scholars chaired by Prof. Dr. Mohammad Abdul Rahim Sultan Al Olama, under the Central Bank's Higher Sharia Authority framework.
Dr. Chilwan has led DIB since July 2013 and ranks among the longest-serving bank CEOs in the Gulf. He joined DIB in 2008 as Chief of Retail Banking after senior roles at HSBC, Dubai Bank, Abu Dhabi Islamic Bank and Mashreq. Under his thirteen-year leadership DIB has grown into a group with assets exceeding USD 115 billion, absorbed Noor Bank, entered Turkey, Kenya and Indonesia, and become the most active bank in sustainable sukuk globally. He holds a PhD and an MBA in Marketing. For investors, Chilwan personifies both strategic continuity and a concentration: the bank's modern identity is to a large degree his construction.
Macedo has been DIB's CFO since 2016, spanning the Noor integration, COVID, the introduction of UAE corporate tax and the record 2025 growth year. Previously CFO of Saudi Hollandi Bank and CFO Africa at Liberty Life. His fingerprints are on the funding strategy: the laddered sukuk program, sustainability-linked issuance at record-tight spreads, and the June 2026 USD 1 billion AT1 that rebuilt capital headroom. His discipline shows in a cost-to-income ratio held in the 26-29% range through the growth surge.
Malhotra has run DIB's consumer bank since February 2015, the architect of the retail franchise that anchors the group's low-cost deposits. Career: NBK (Head of Consumer Banking MENA), Arab Bank, ANZ Grindlays, Citibank India; BITS Pilani 1987. At DIB he has overseen XTRA, the rabbit youth app, and the consolidation of digital channels under DIB 'alt'. In an environment where digital challengers target exactly DIB's retail base, his franchise is where that battle will be fought.
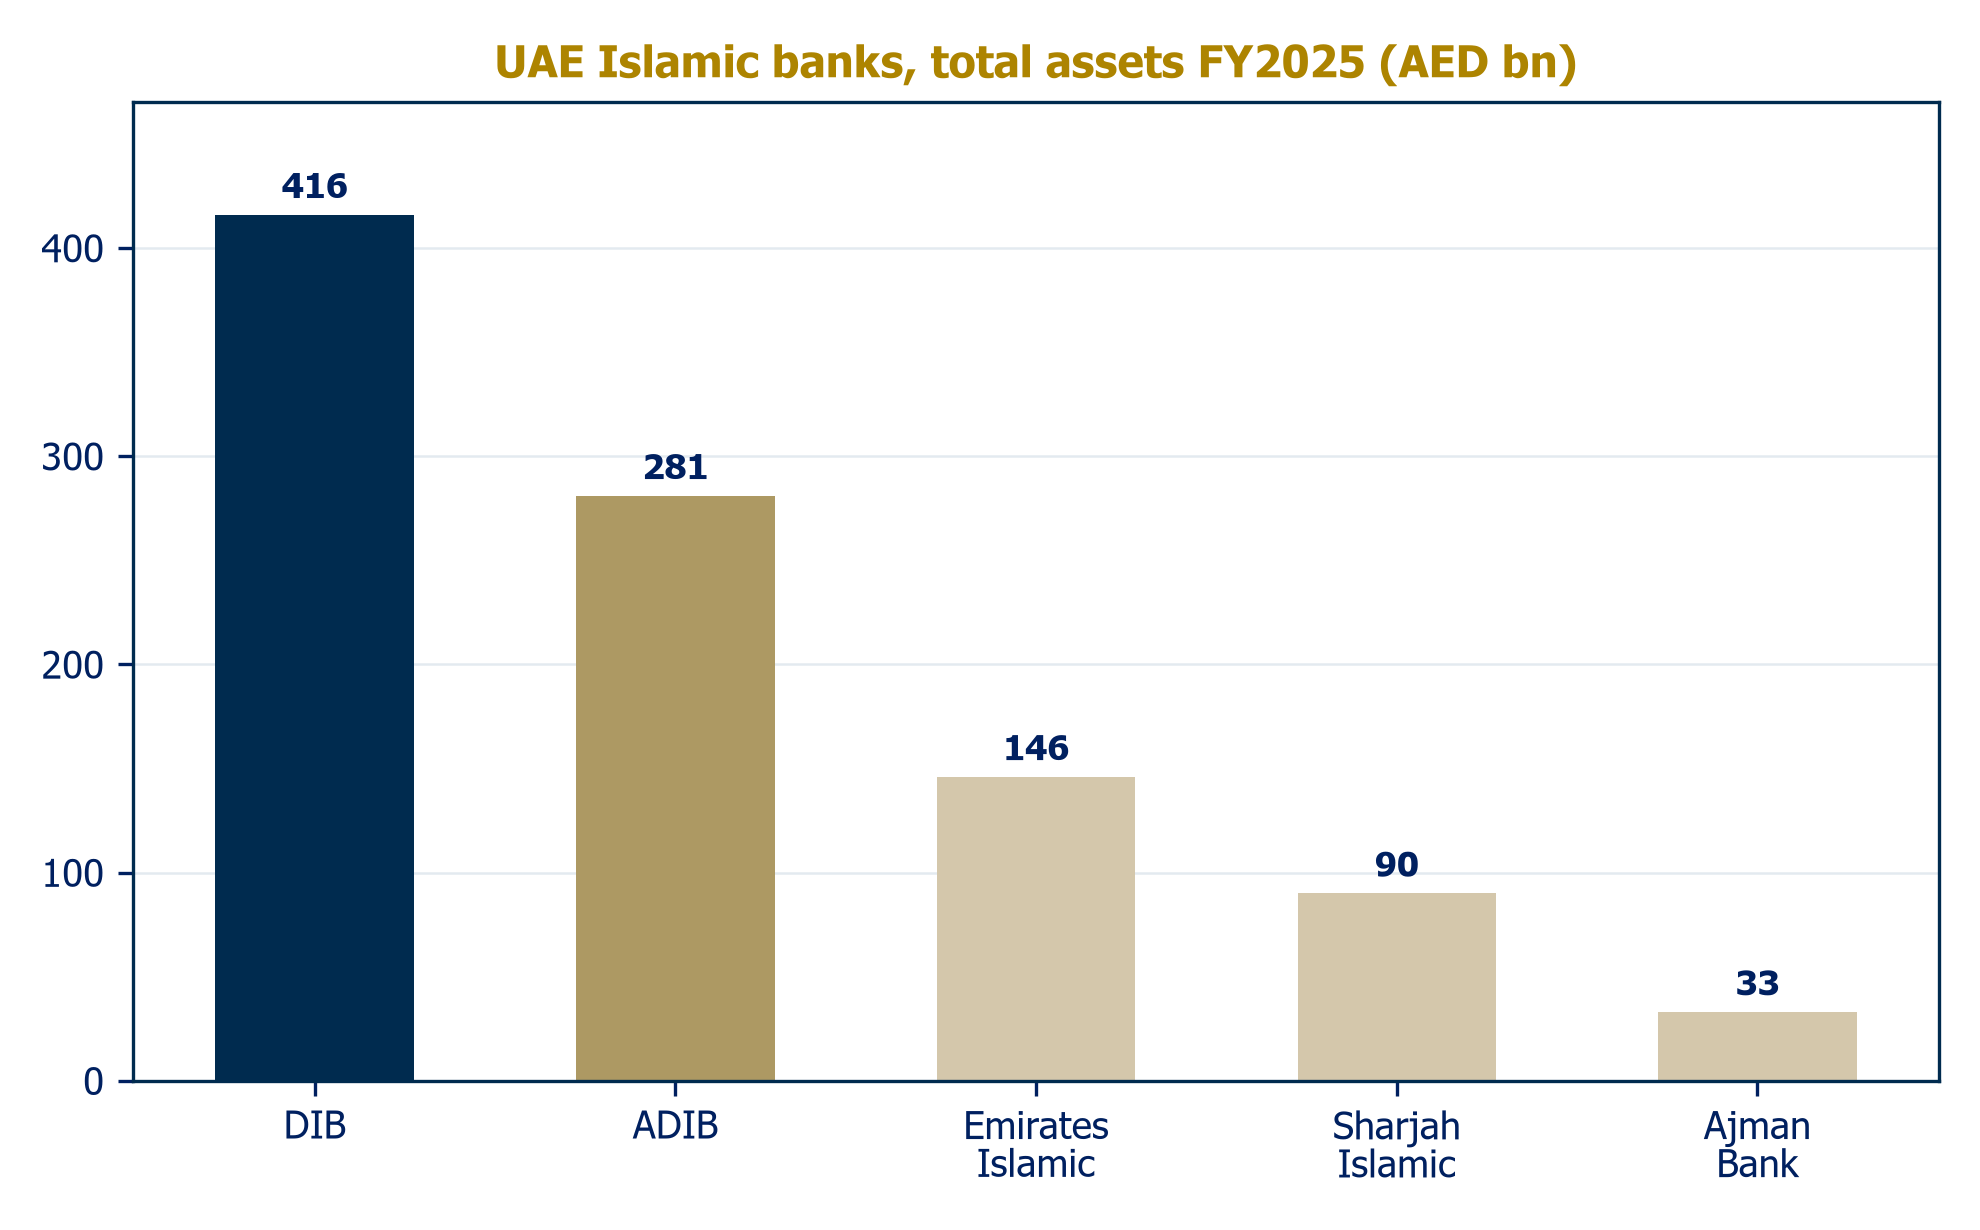
DIB competes on three fronts. Against UAE Islamic banks: ADIB (AED 281bn assets, ~28% ROE, rewarded at 2.66x book) is the reference peer; Emirates Islamic was 2025's fastest grower; Sharjah Islamic and Ajman are sub-scale but compounding. Against the conventional giants: ENBD (assets above AED 1 trillion, the USD 2.75bn RBL India deal) and FAB define the scale frontier. Against regional champions: Al Rajhi and KFH compete for capital-markets flow and the global-champion narrative. A newer front is digital: ruya onboarded ~60,000 customers in its first year targeting exactly the young Islamic-first customer.
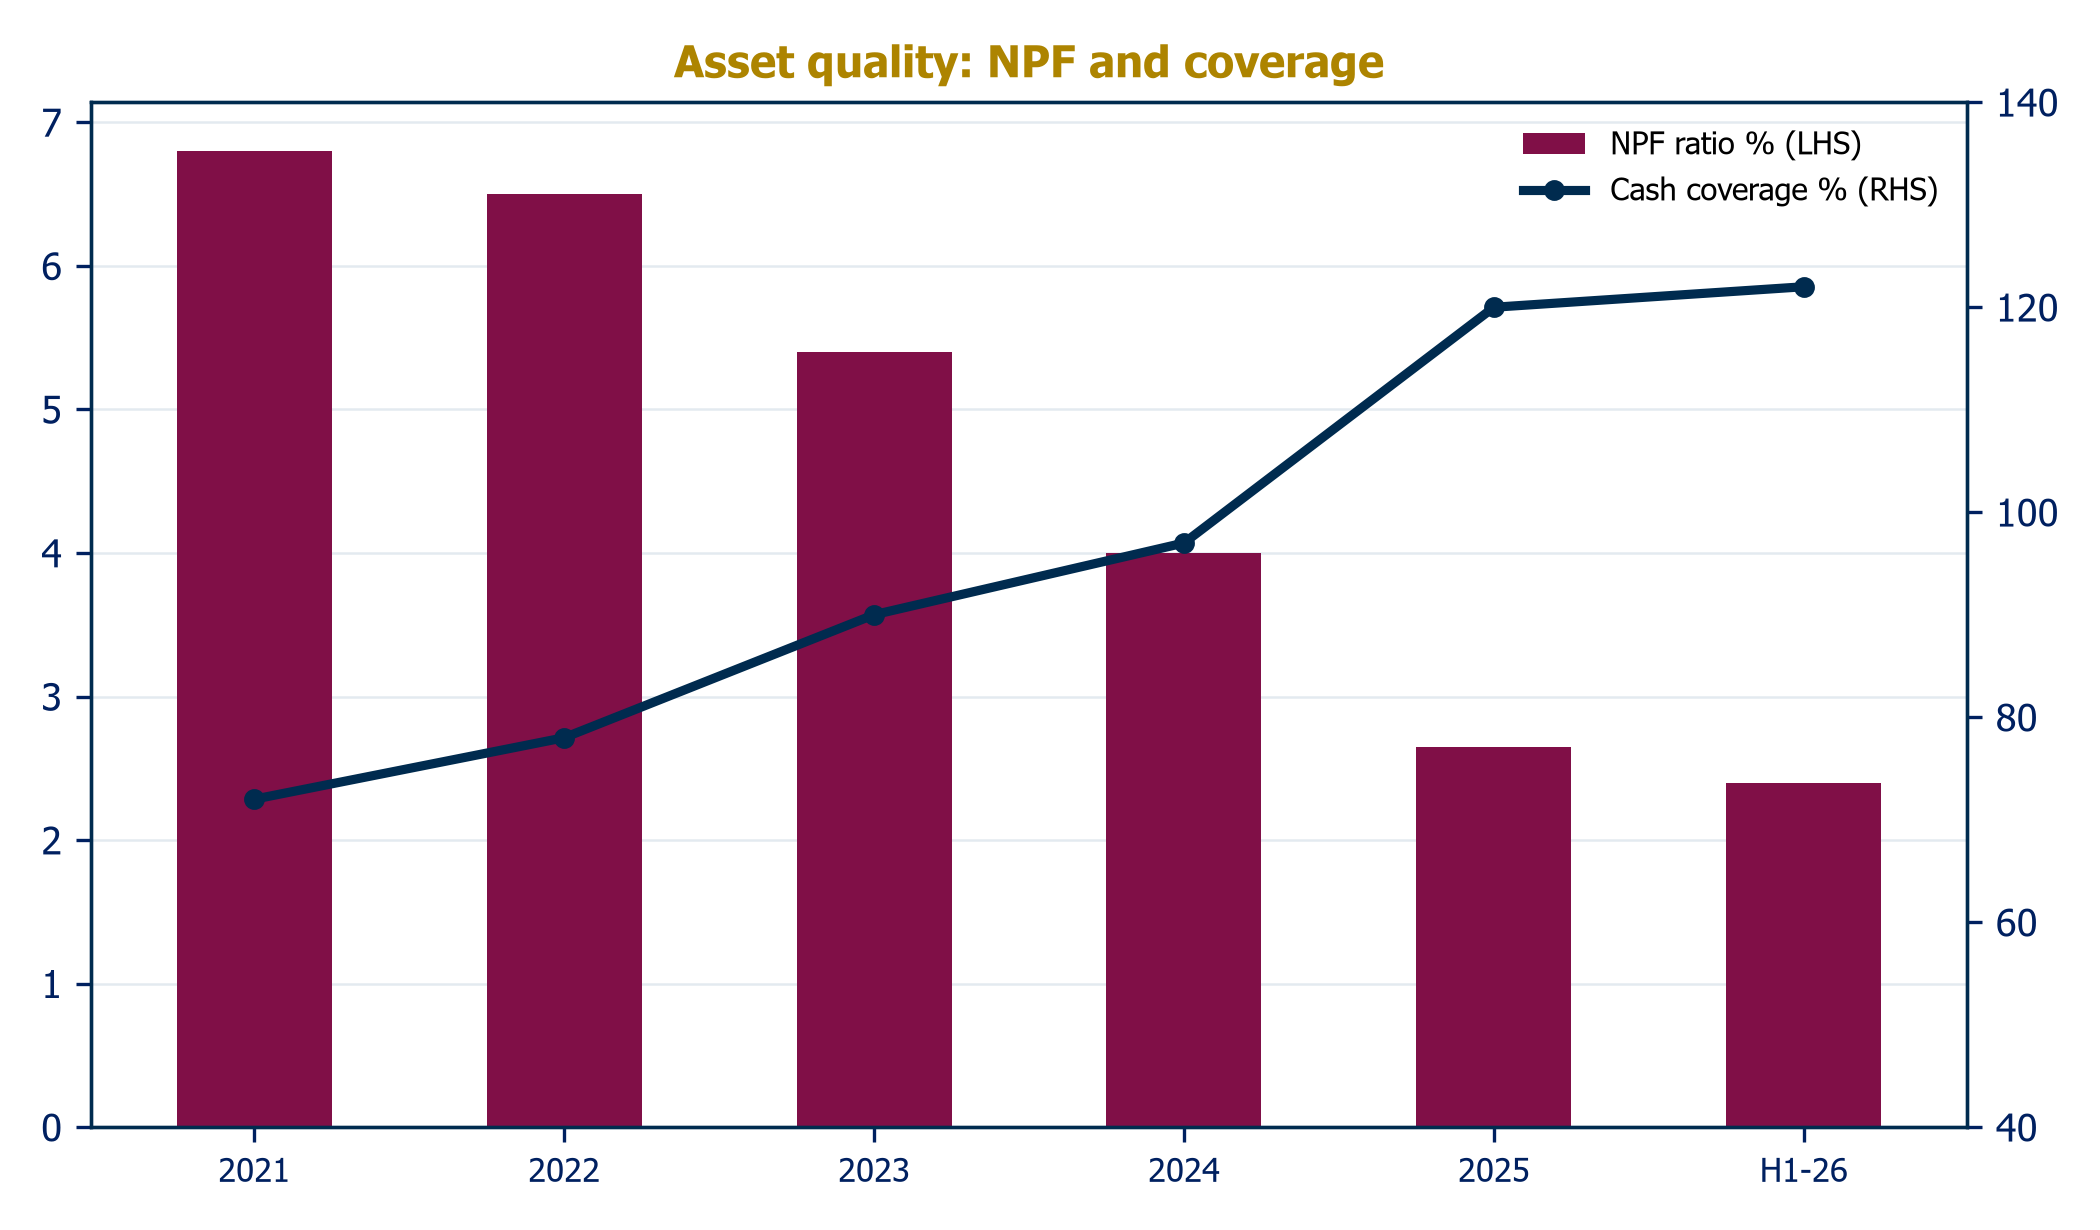
DIB entered this decade digesting the Noor acquisition and a pandemic credit cycle: 2021 carried AED 2.4 billion of impairments at a 99bps cost of risk against an NPF ratio of 6.8%. The subsequent four years were a textbook workout: impairments fell every year, the NPF ratio was cut by two-thirds, cash coverage rose from 72% to 120%, and pre-tax profit doubled to AED 9.0 billion. By the time the growth year arrived, the balance sheet had been scrubbed.
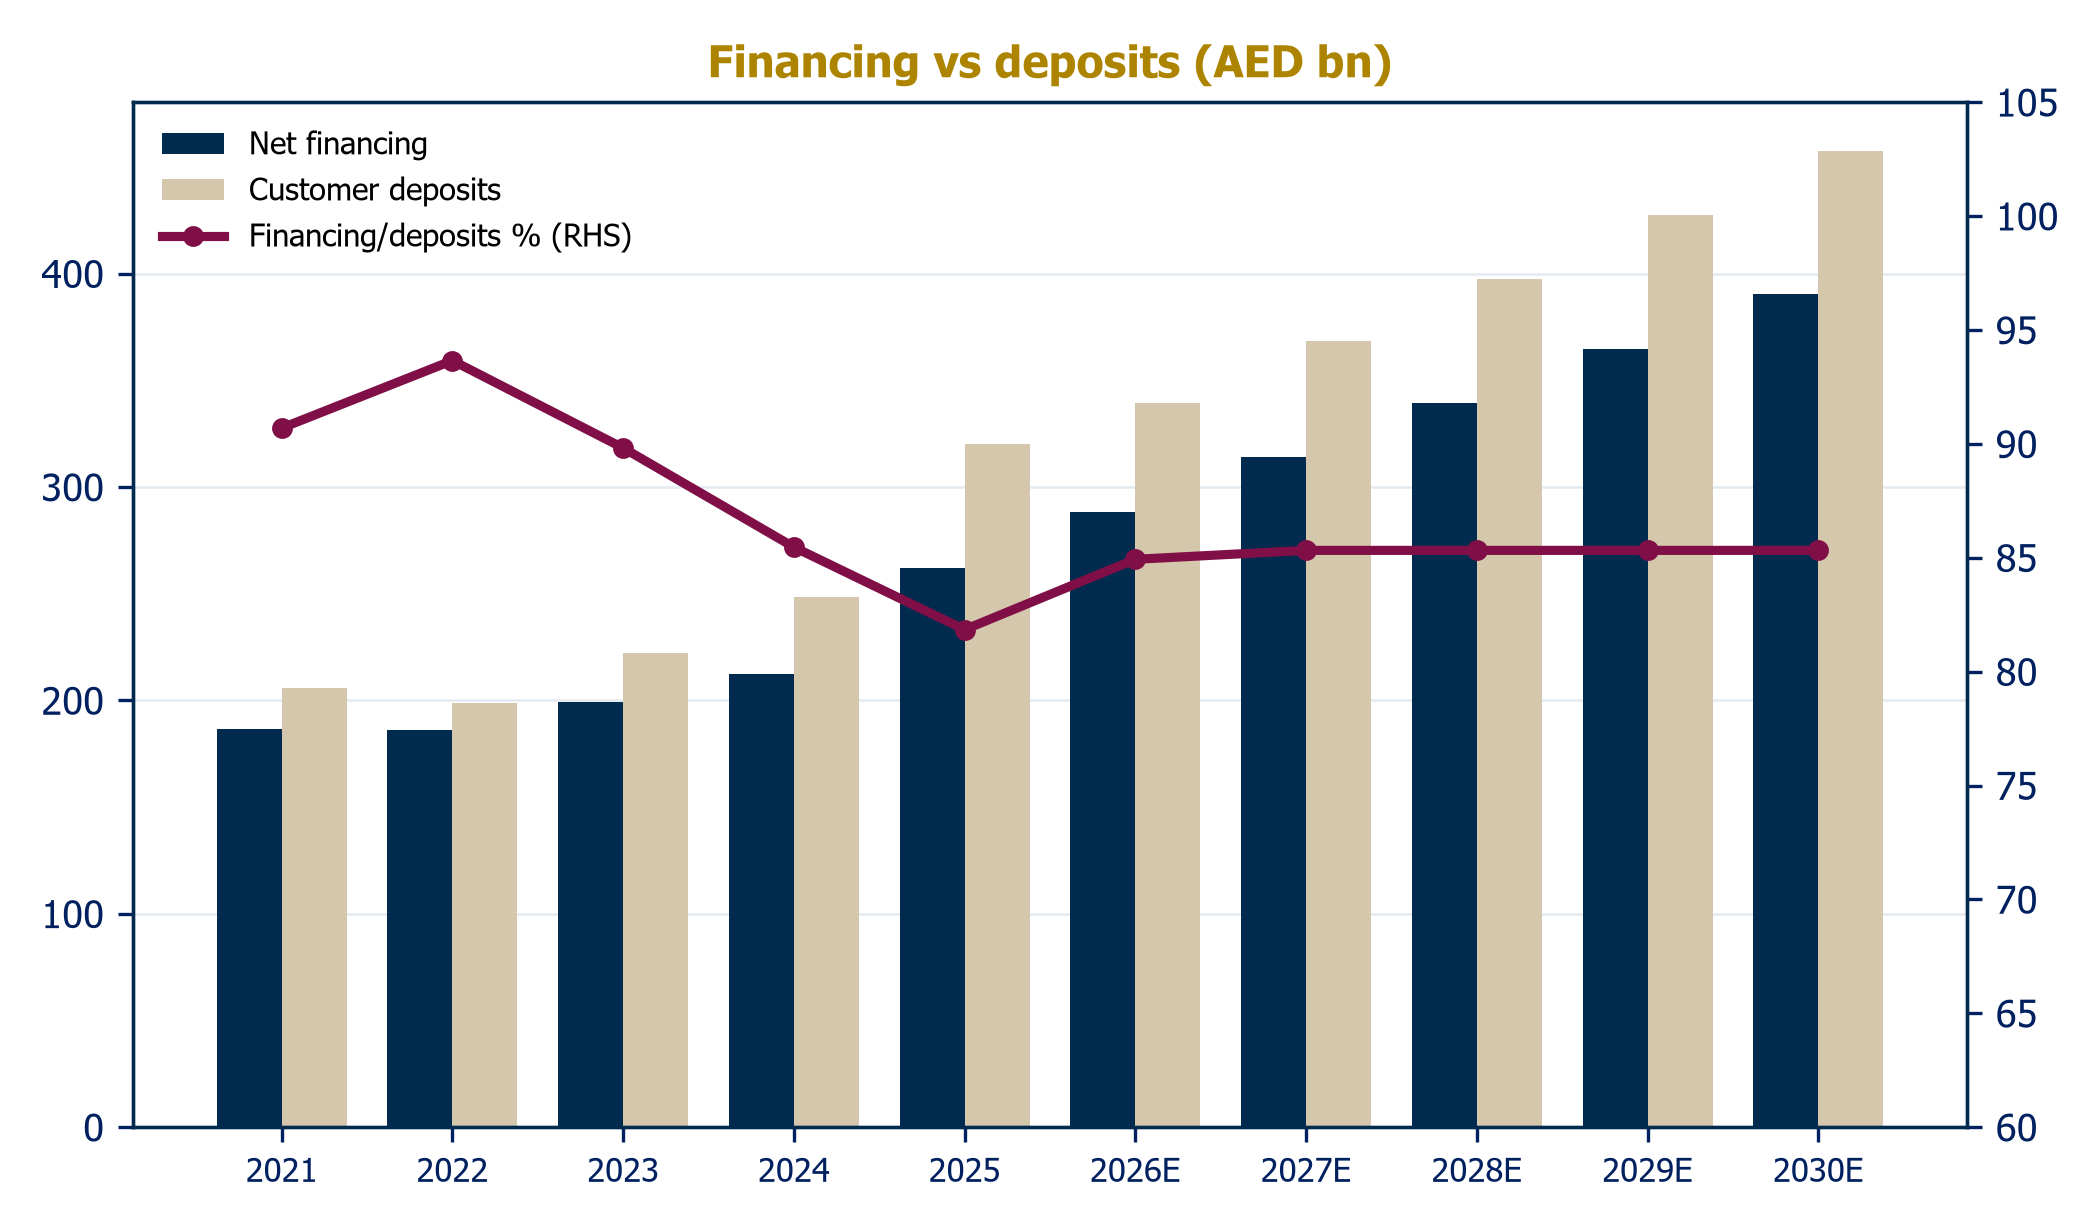
FY2025 was the strongest balance-sheet year in DIB's history: total assets up 21% to AED 416 billion, customer deposits up 29%, net financing up 23%, and AED 124 billion of gross new financing originated, up 80% year on year. Asset quality reached decade bests: NPF at 2.65%, total coverage 160%, cost of risk just 14bps. The growth was deliberately deposit-led, trading near-term margin for balance-sheet optionality.
Gross revenue rose 10% to AED 12.4 billion and operating profit 6%, yet net profit held flat at AED 3.74 billion. Three forces: the net profit margin compressed to 2.4%; impairments normalized to AED 489 million (cost of risk 28bps versus an unrepeatable 14bps); and the tax line took 13.8% of pre-tax profit. Management maintained full-year guidance: financing growth ~10%, NPM 2.3%, cost-to-income 28%, pre-tax ROTE 21%.
| Metric | Q1 2026 | H1 2026 | FY2026 guidance |
| Revenue growth, YoY | +13% | +10% | n.a. |
| Net profit margin | 2.5% | 2.4% | 2.3% |
| Cost-to-income | 28.2% | 29.0% | 28% |
| NPF ratio | 2.5% | 2.4% | 2.5% |
| CET1 | 12.6% | 13.0% | n.a. |
| Pre-tax ROTE | 21.0% | 20% | 21% |
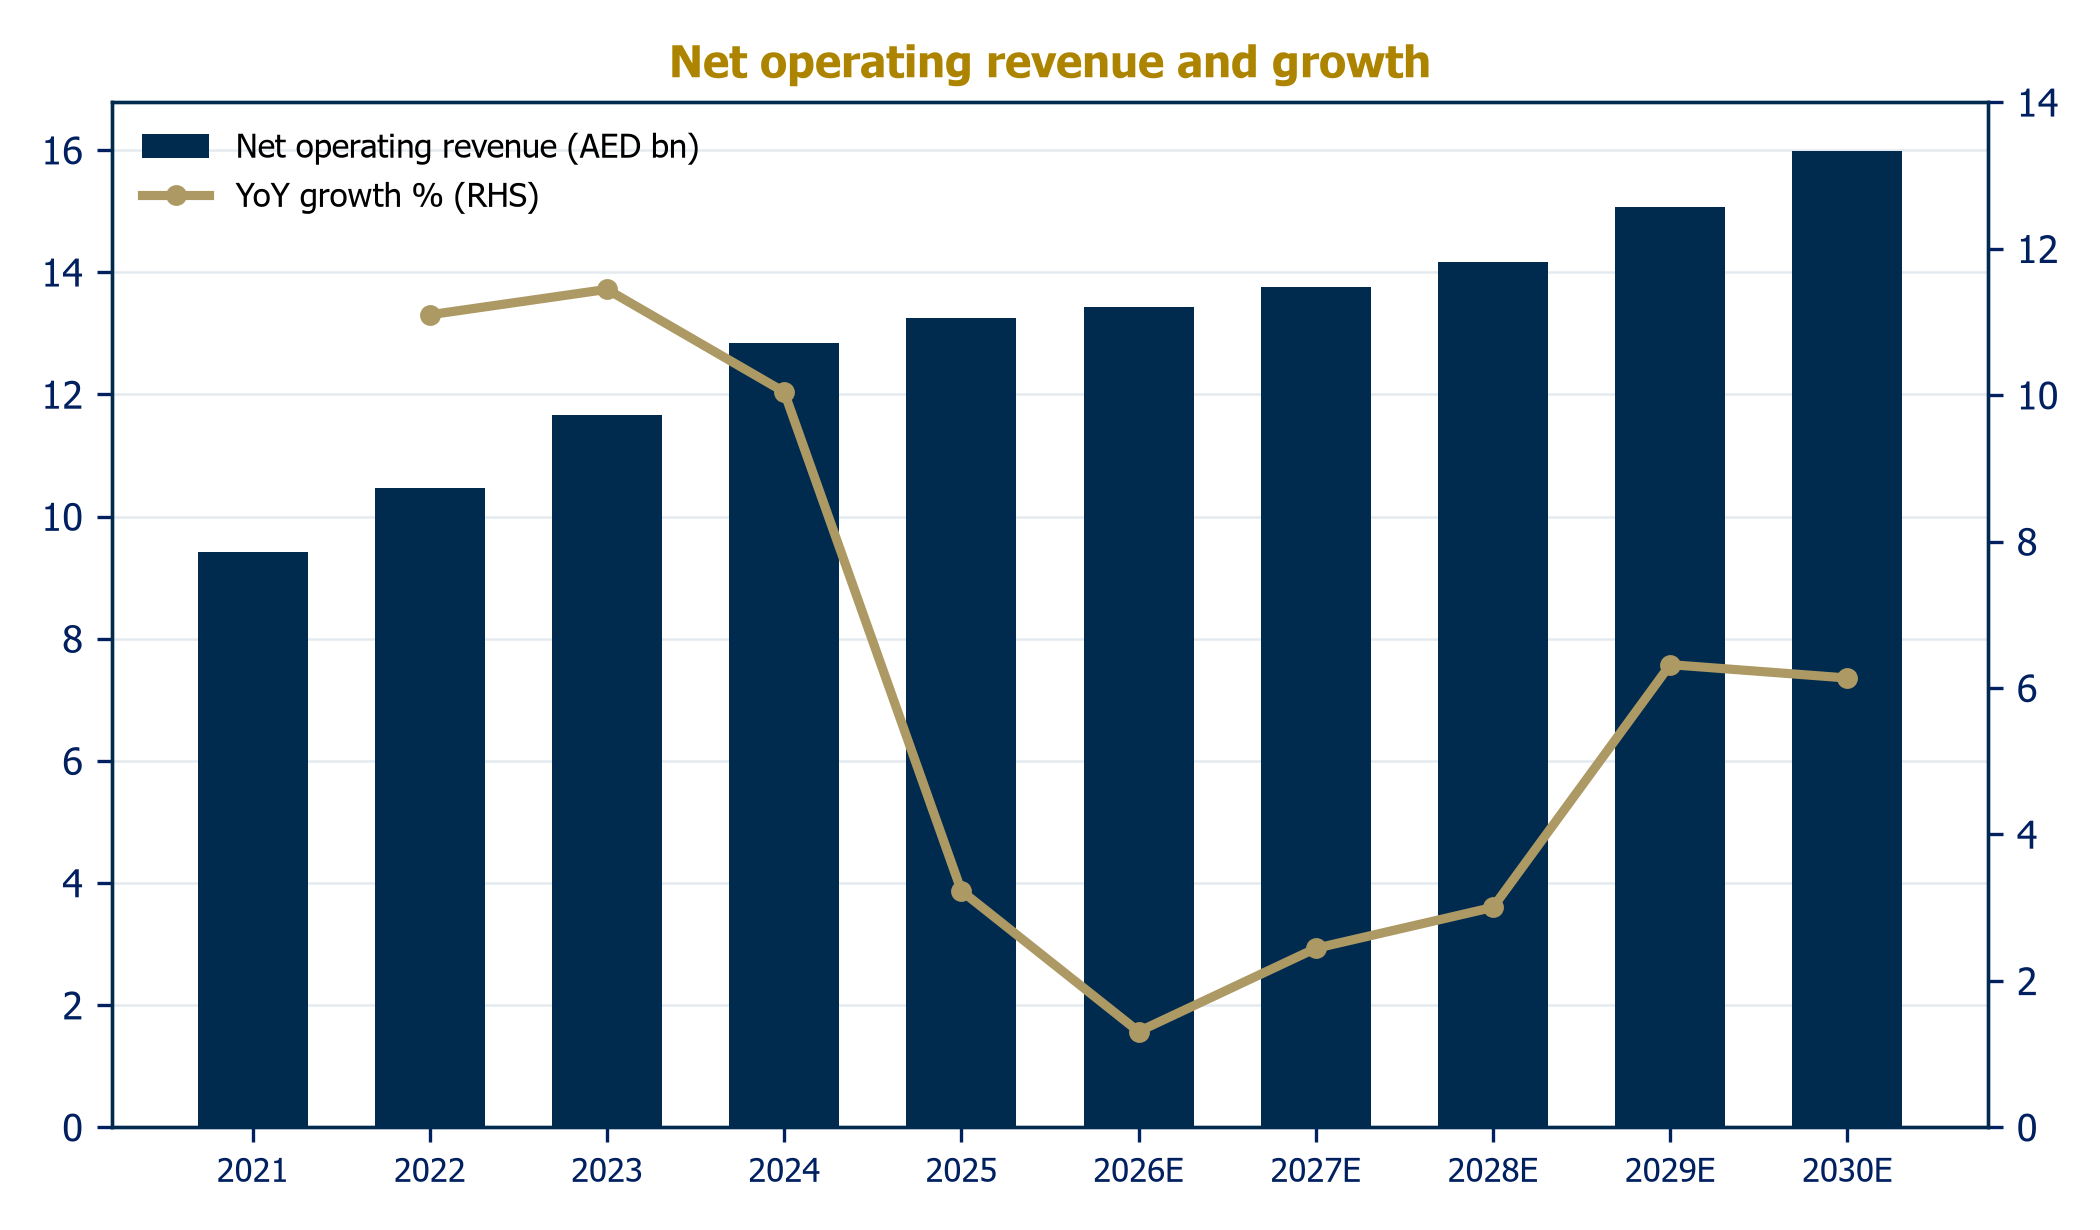
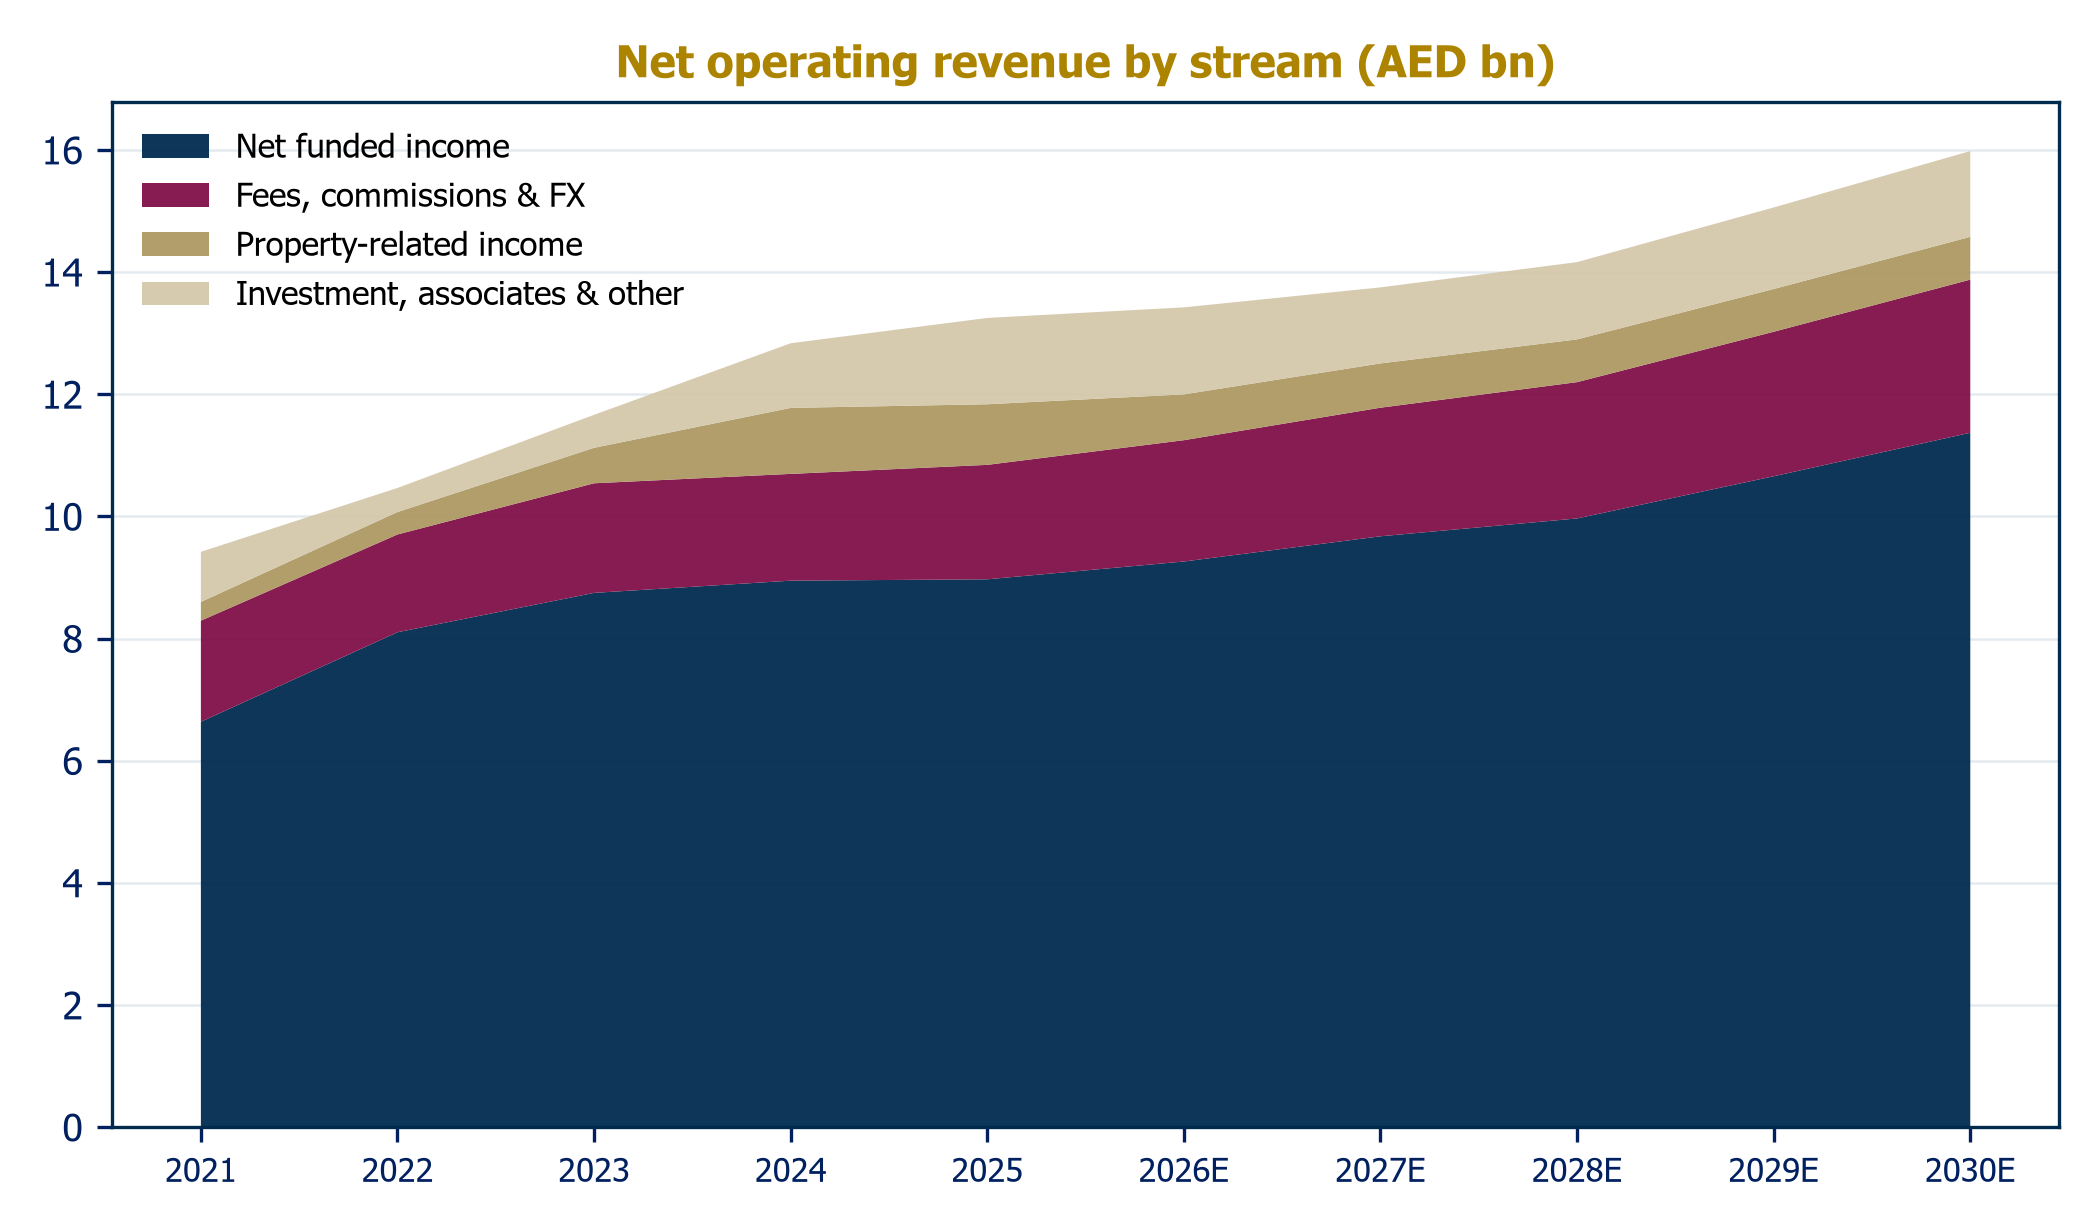
Our model is calibrated so that 2026 estimates land on the actual H1 run-rate, and follows management guidance where it exists: financing growth of 10% in 2026 tapering to 7% by 2030; yields declining with the expected Fed path while funding costs reprice more slowly; fee income compounding at 6%; cost growth of 4-5%; cost of risk stepping from 30bps to a mid-cycle 45bps; a 15% effective tax rate from 2027.
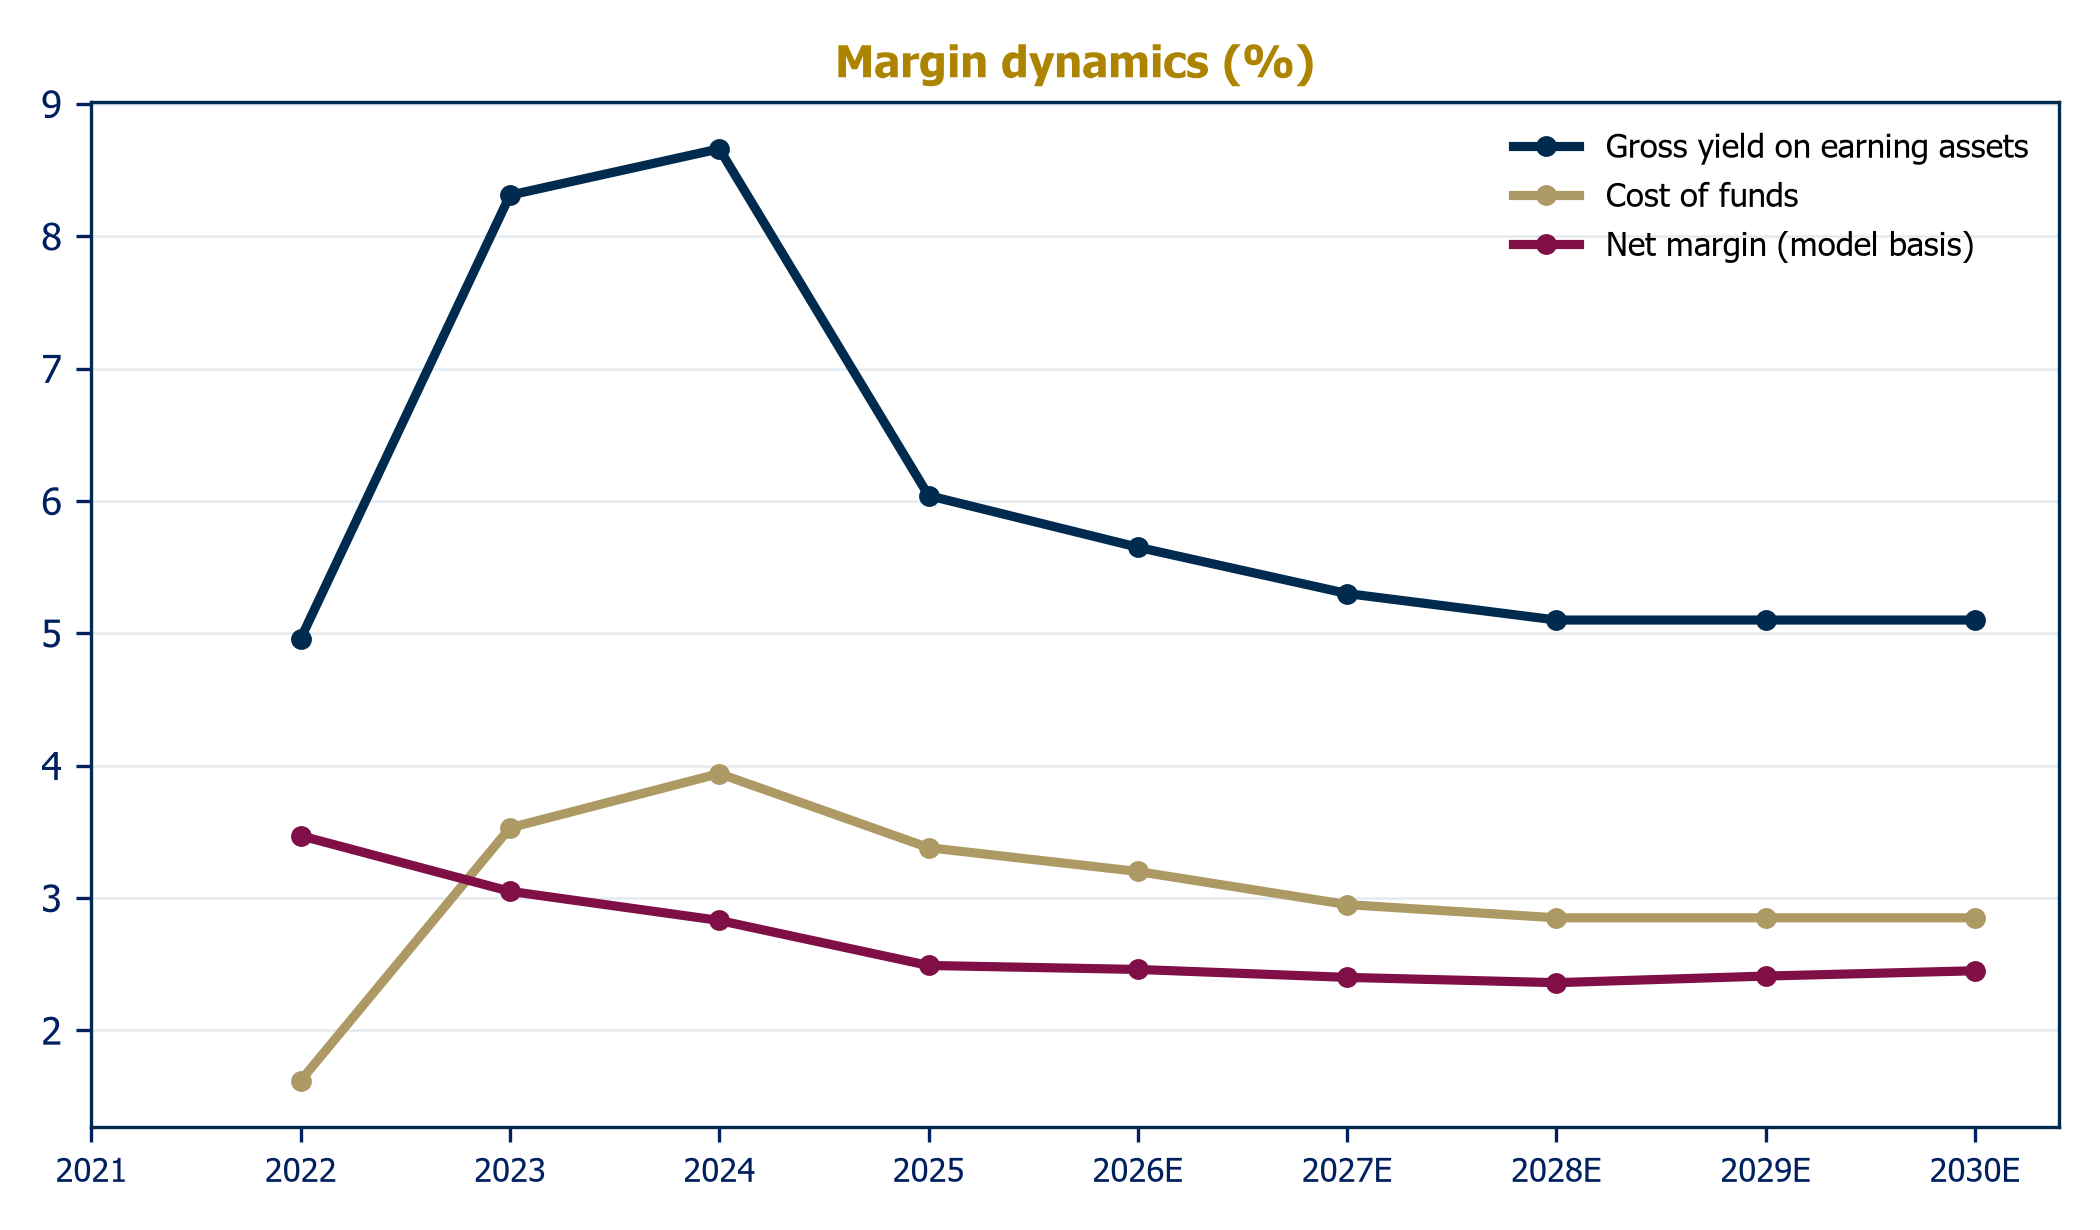
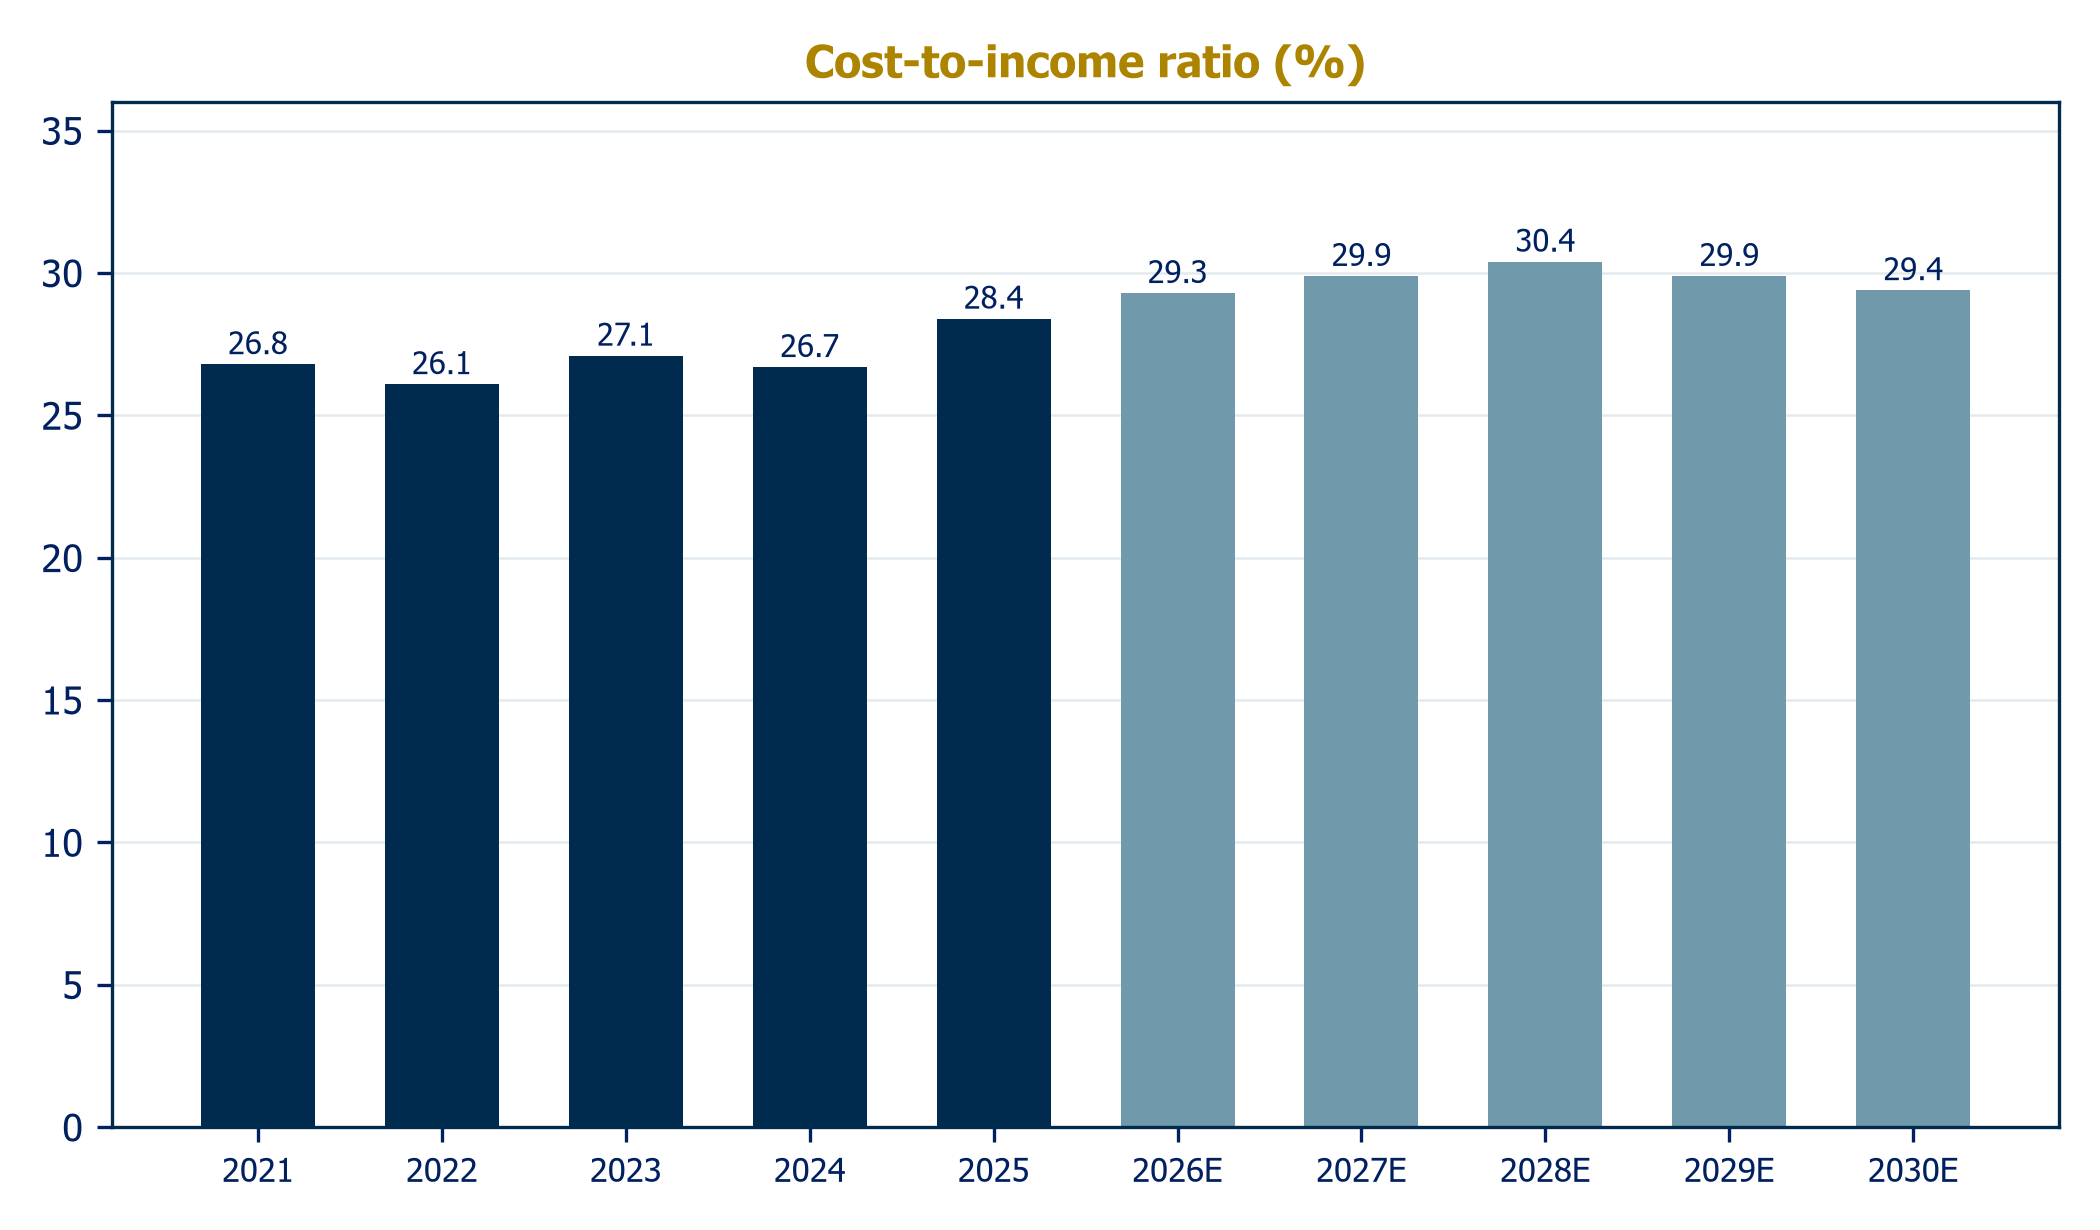
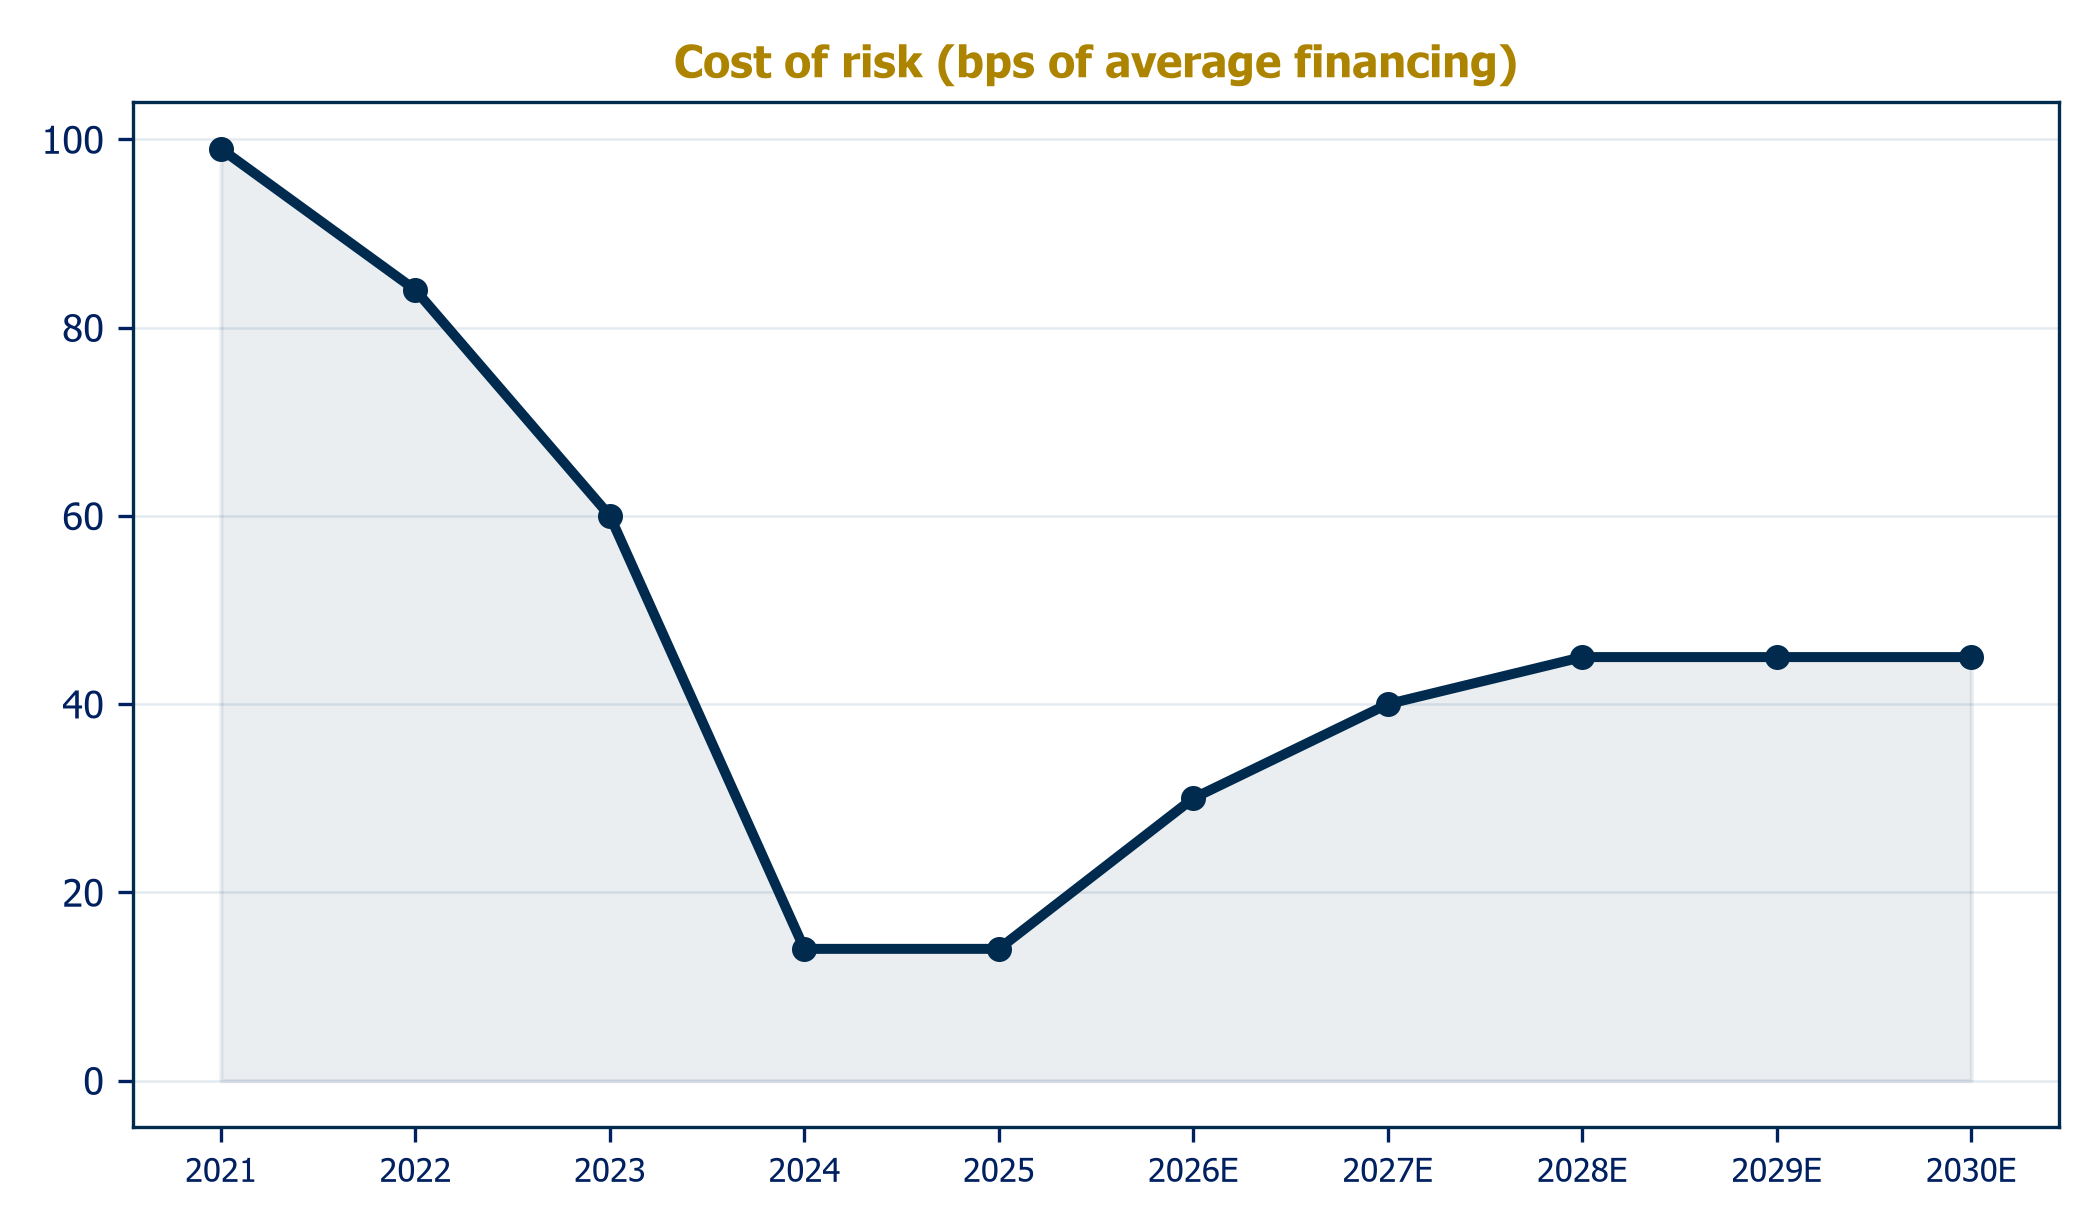
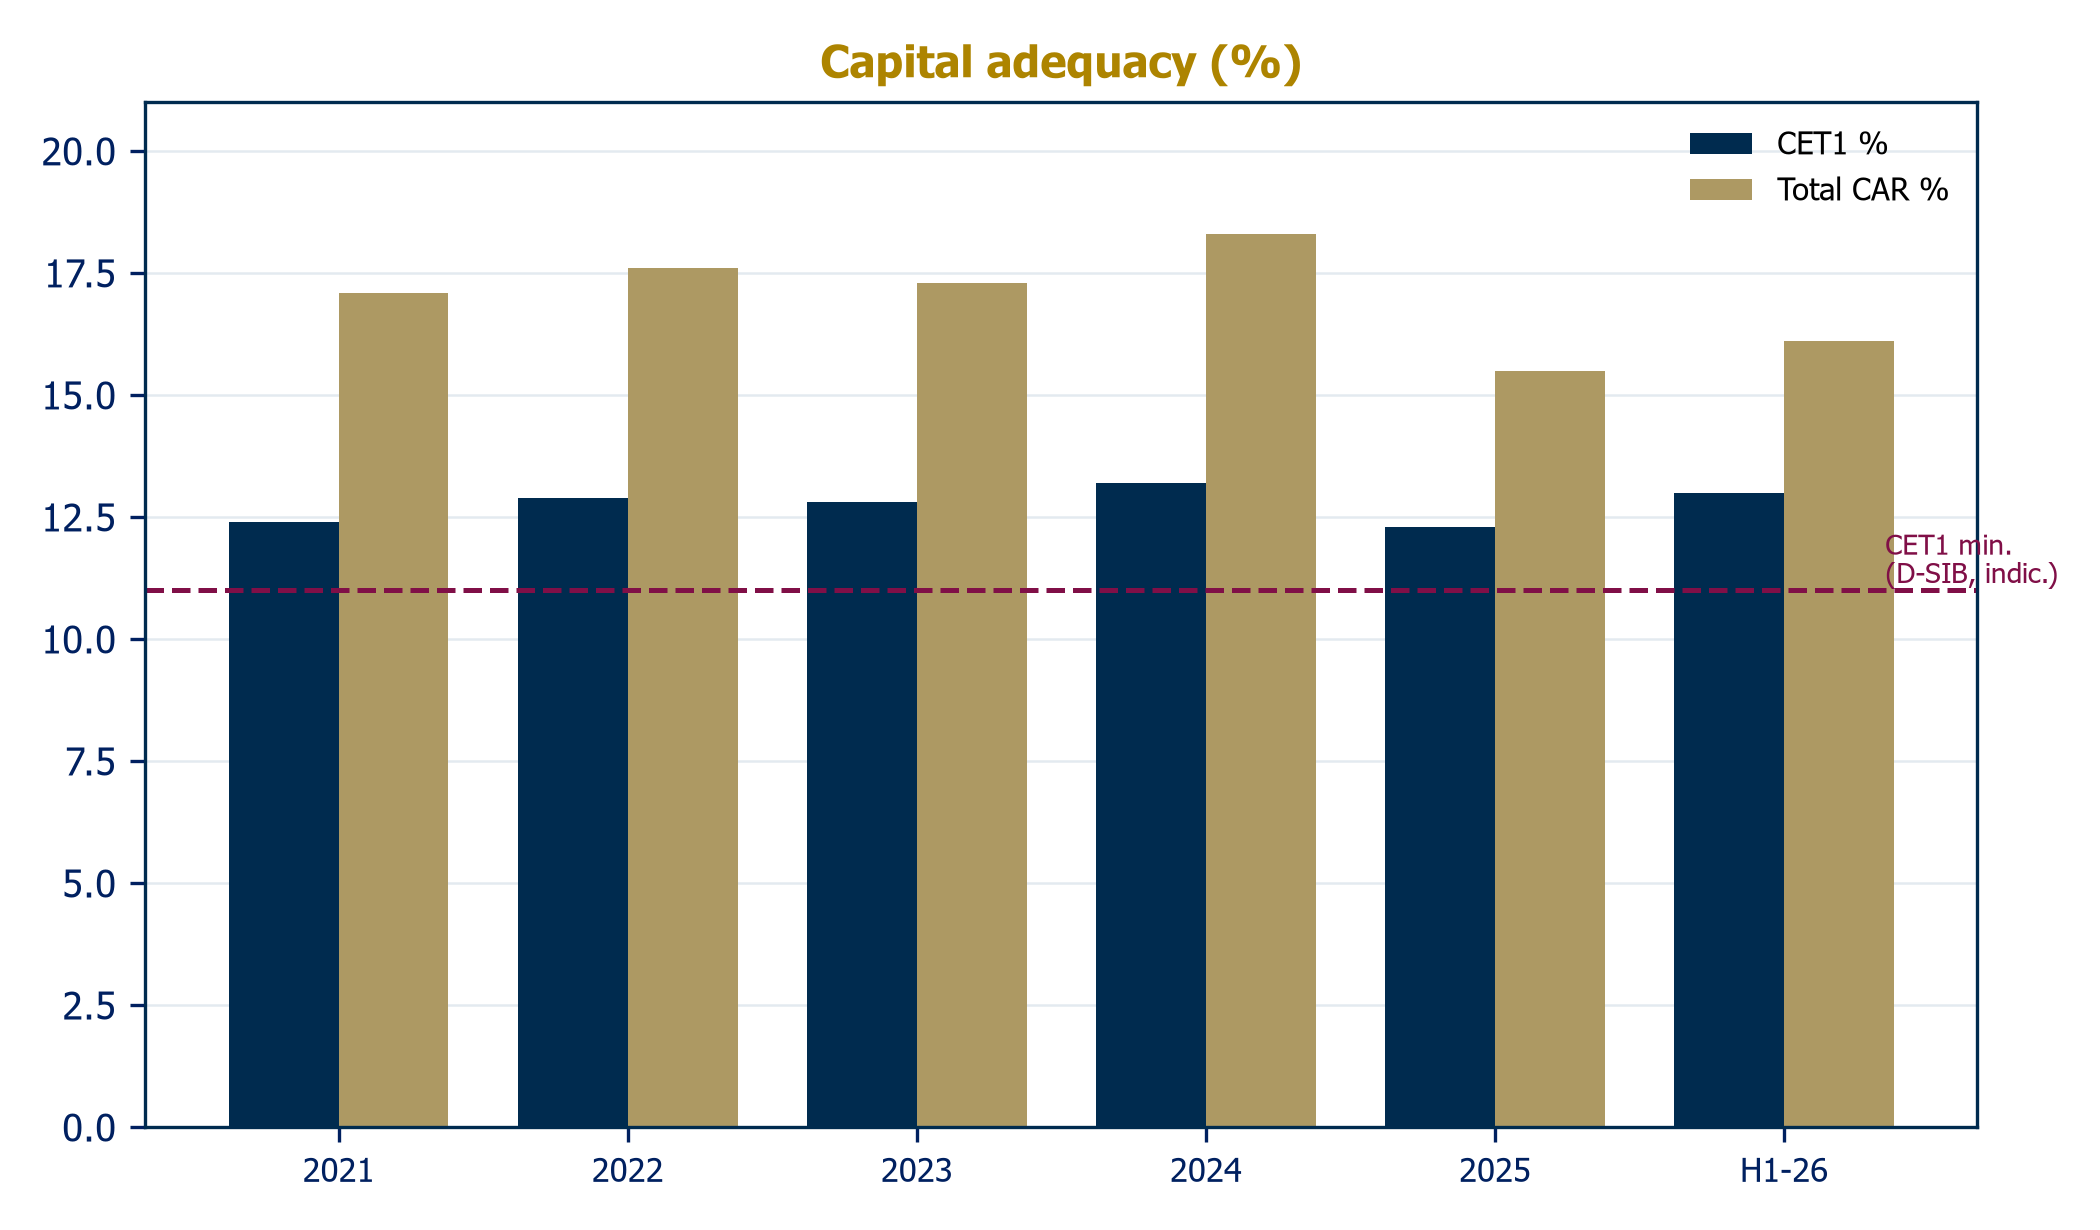
The cost-to-income ratio has drifted to 28-29% as revenue growth slowed against continued investment; our base case holds it near 29-30%. The credit line is the bigger swing factor: 14bps of cost of risk in 2024-2025 was a gift of recoveries, and we model a step to 45bps by 2028. Even then, coverage at 158% and an NPF near 2.4% leave the balance sheet in its best shape since before the global financial crisis. Capital is the constraint to watch: CET1 of 13.0% is adequate but not lavish, which is exactly why the bank has twice tapped AT1 markets since late 2024.
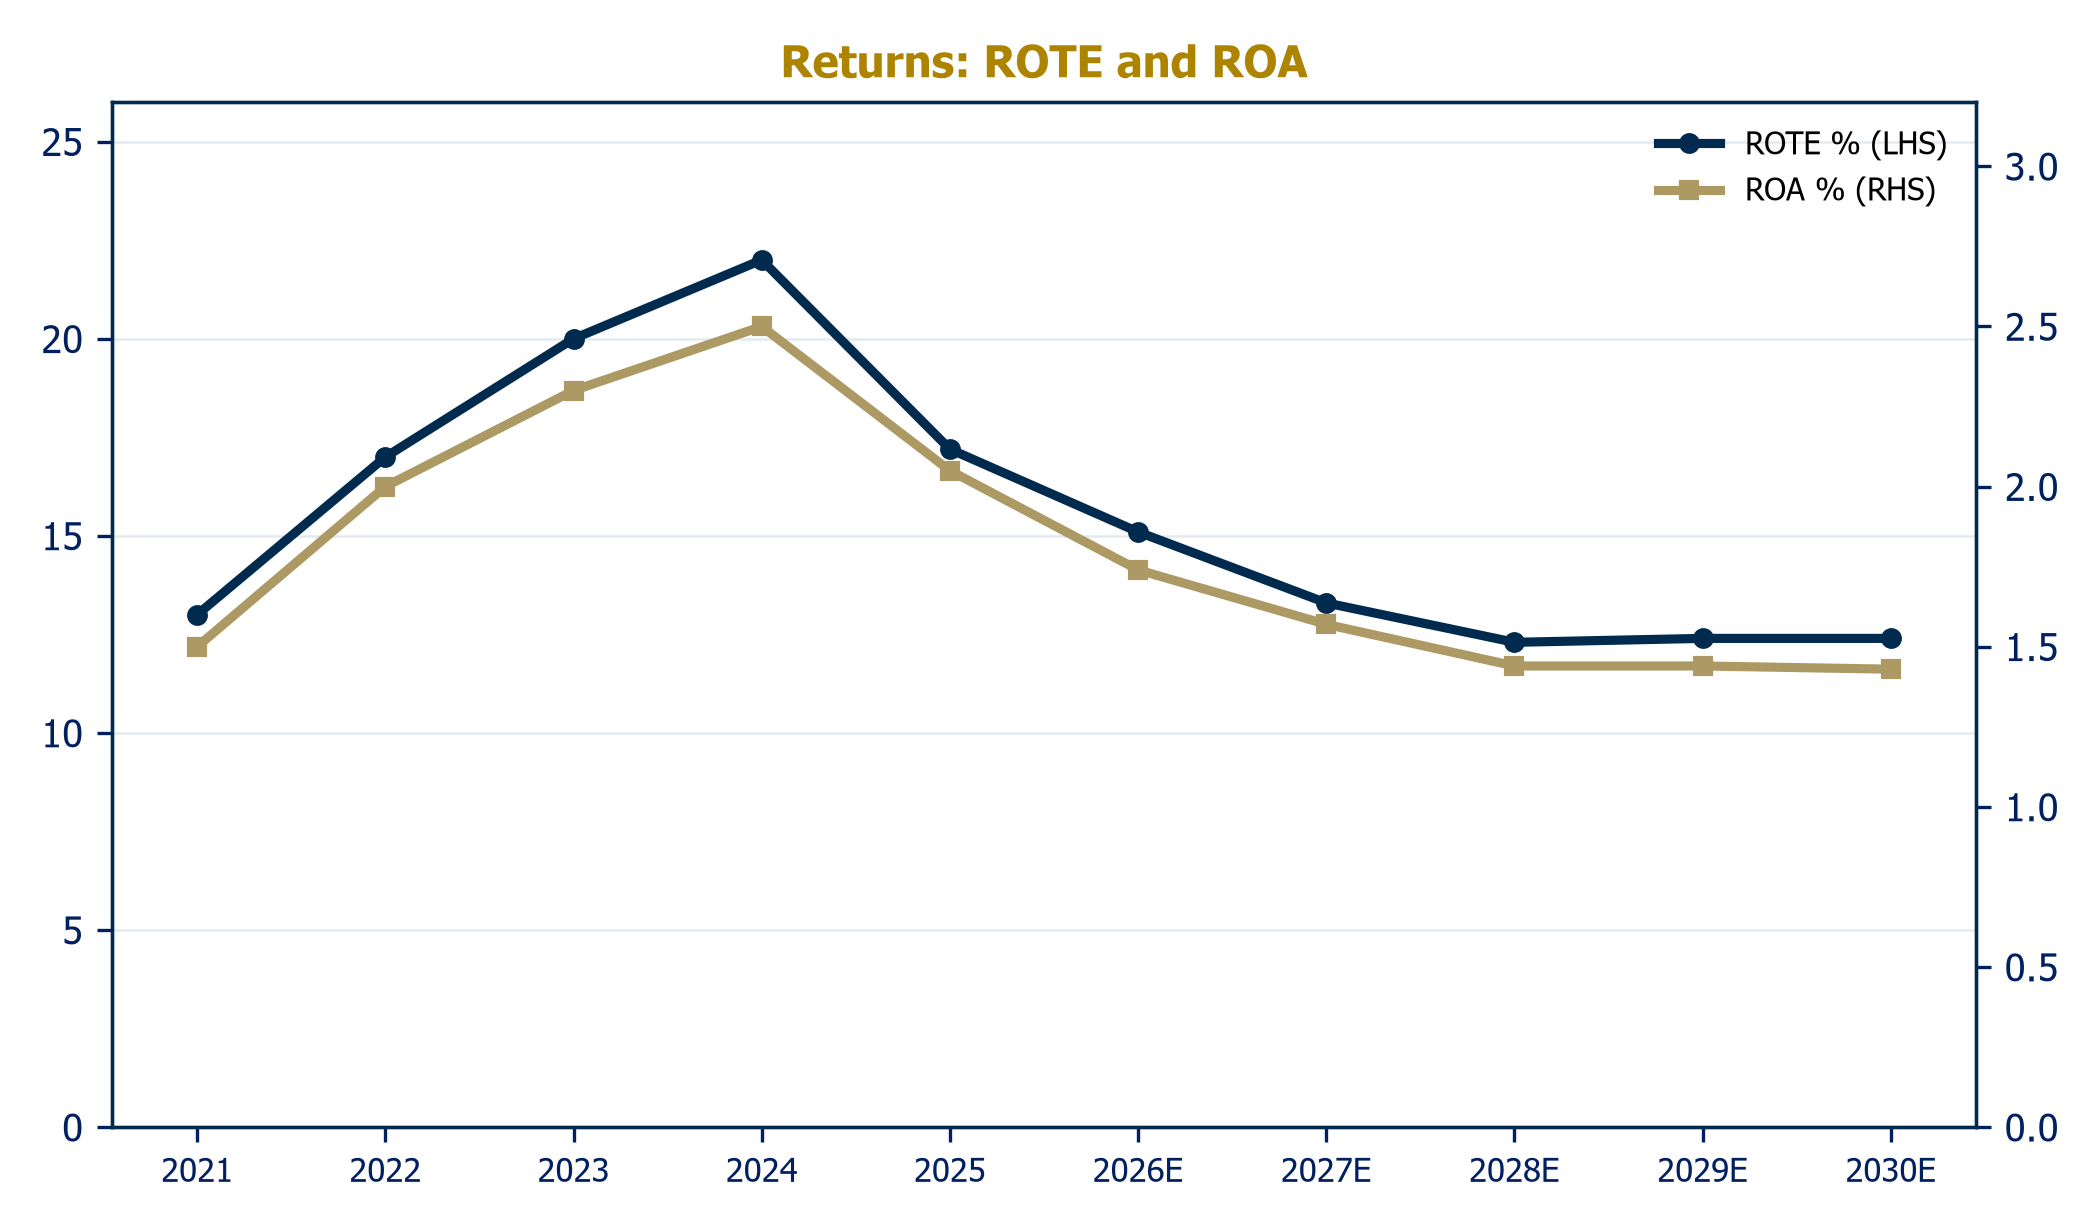
Net profit of AED 7.45 billion in 2026, a trough near AED 7.14-7.17 billion in 2027-2028, then recovery to AED 8.15 billion by 2030. EPS follows from AED 0.93 to a trough of AED 0.89 and back to AED 1.02, above the 2024 peak. The uncomfortable output is returns: with a roughly 40% payout, equity compounds faster than earnings, and post-tax ROTE settles near 12-13% from 17% in 2025. That single ratio is the pivot of the valuation debate.
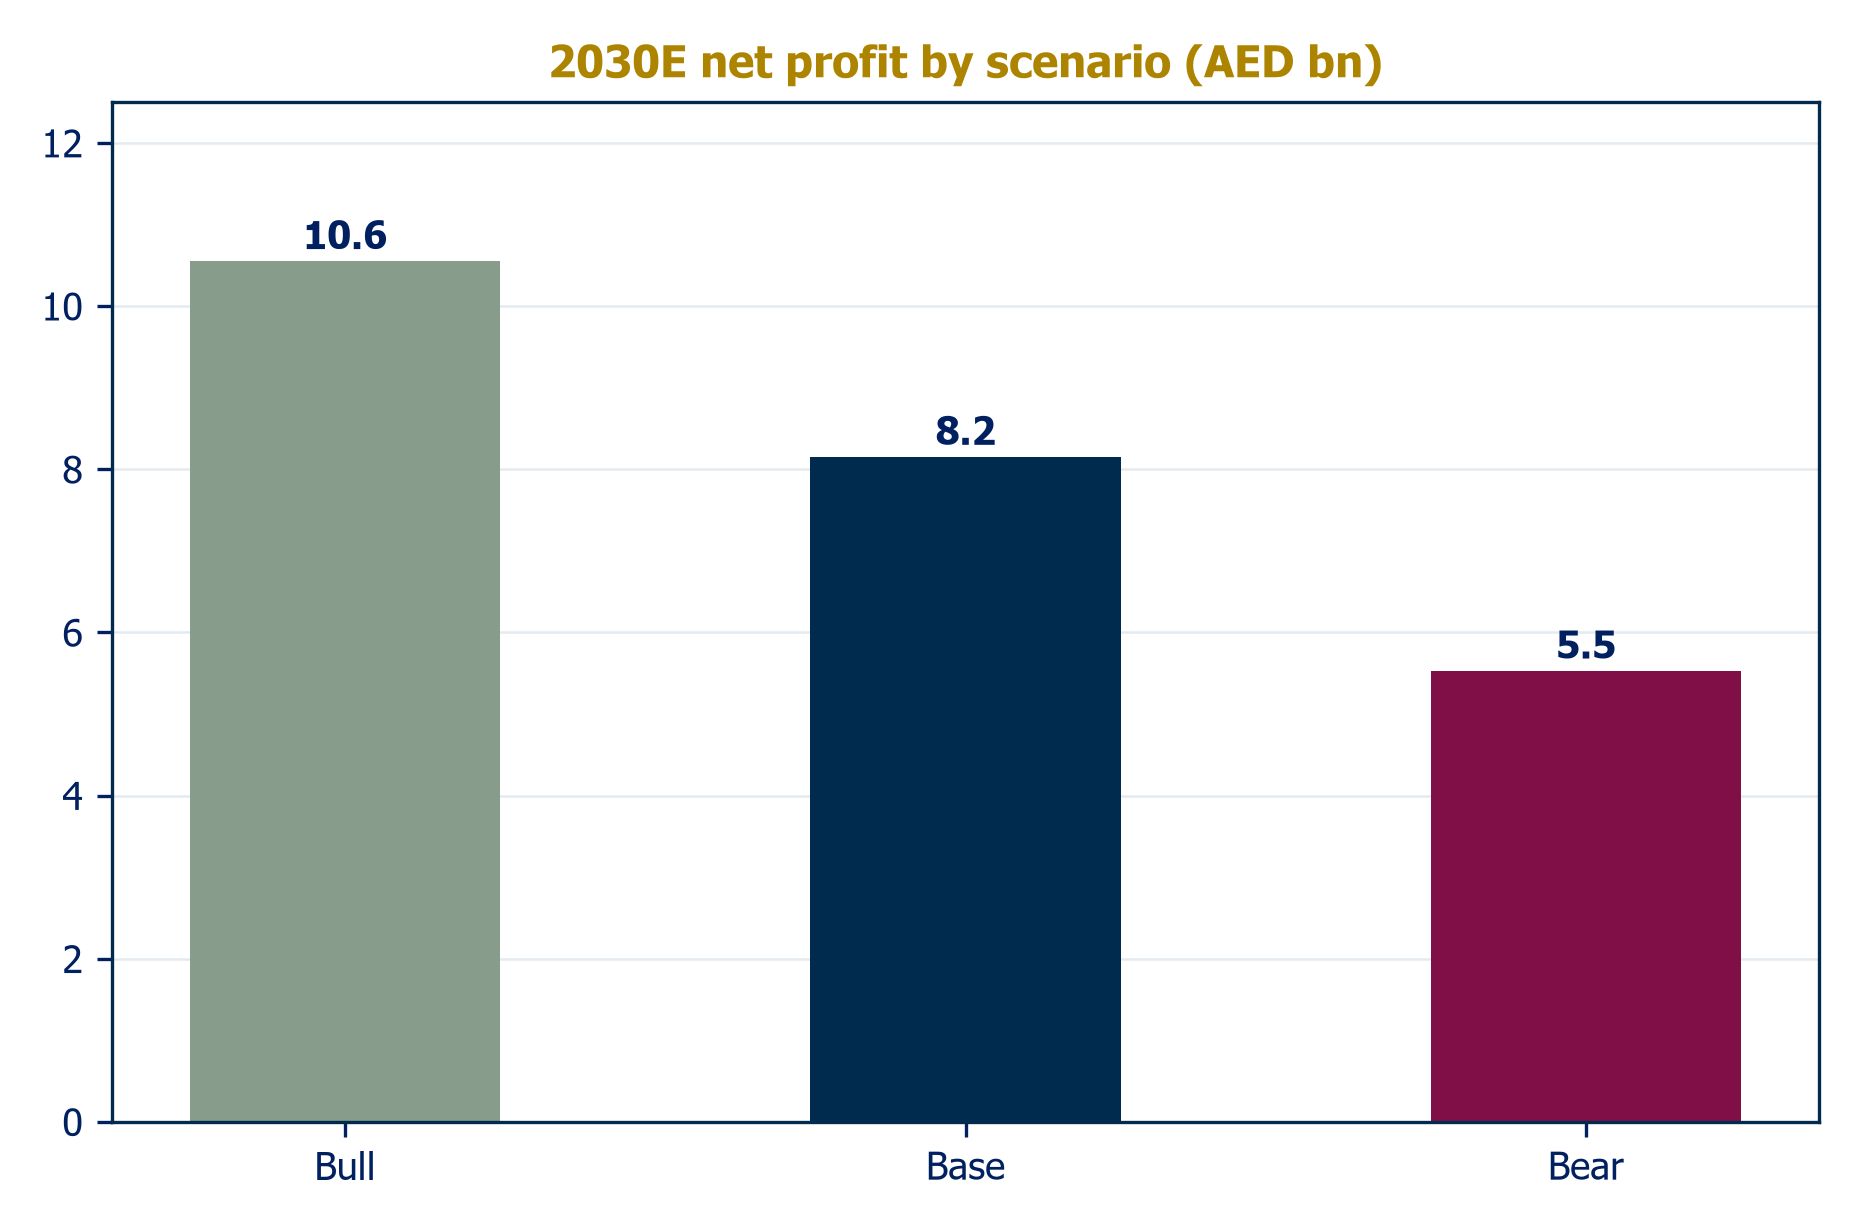
| Scenario (2030E) | Bull | Base | Bear |
| Earning asset growth (CAGR) | 11.0% | 8.0% | 5.0% |
| Net profit margin | 2.45% | 2.30% | 2.10% |
| Cost of risk (bps) | 30 | 42 | 65 |
| Net profit (AED bn) | 10.6 | 8.2 | 5.5 |
| EPS (AED) | 1.34 | 1.02 | 0.67 |
Every initiation needs to answer one question above all others. For DIB in 2026 the question is not whether the franchise is good, fifty years of evidence answers that, but why the market stopped paying for it, and what would make it start again.
DIB closed at an all-time high on 9 February 2026, the session before FY2025 results. It has since fallen roughly 28%, is down 25.6% over twelve months against ADIB up 9.5%. The de-rating happened while the company was reporting record assets, decade-best asset quality, and maintained guidance. Street consensus sits at Hold with an AED 8.21 target; nobody downgraded the franchise. The stock simply stopped being paid for.
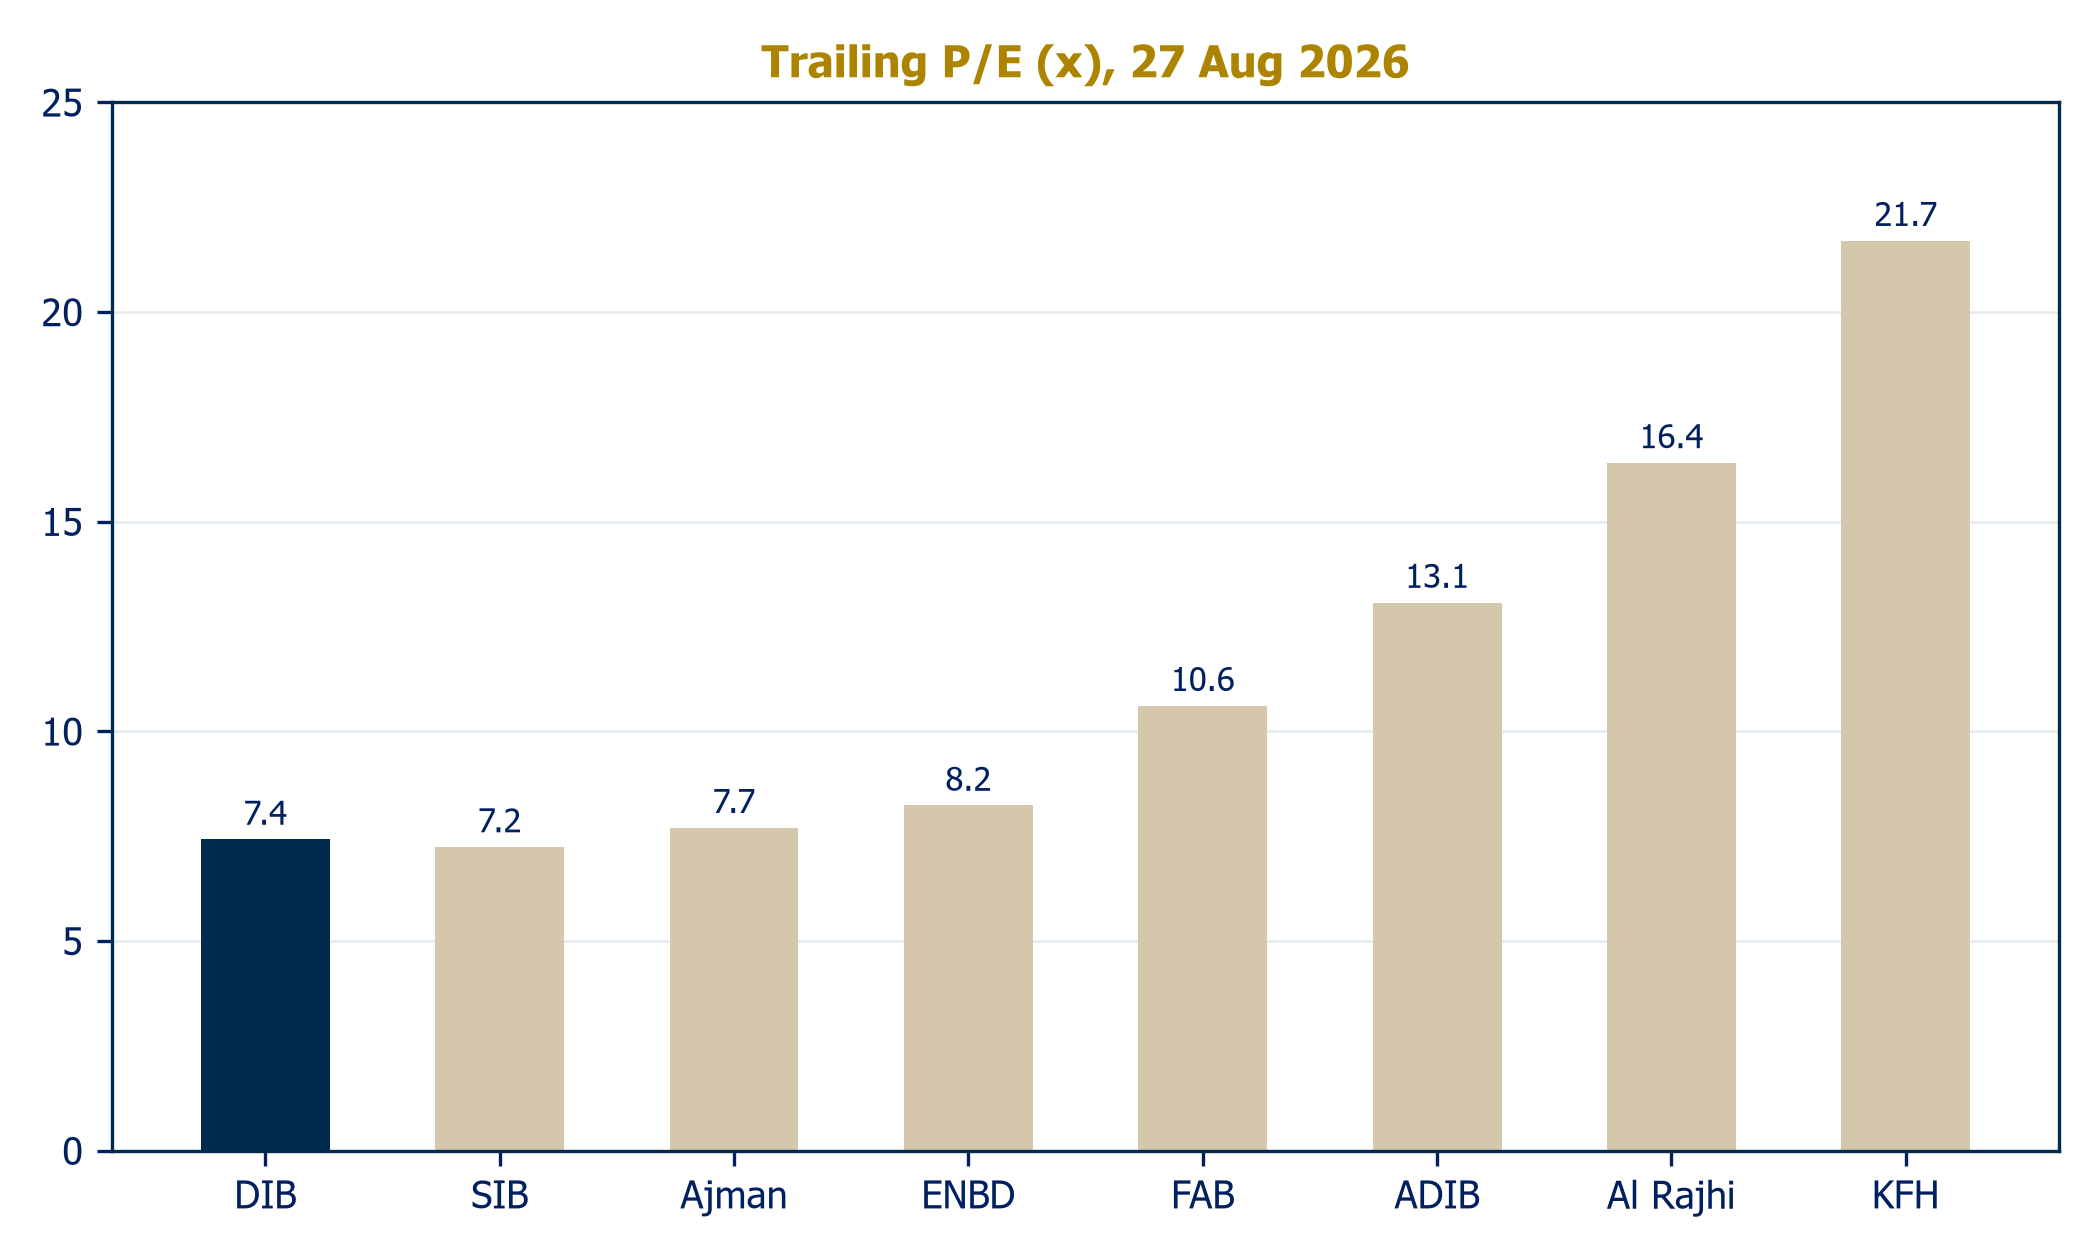
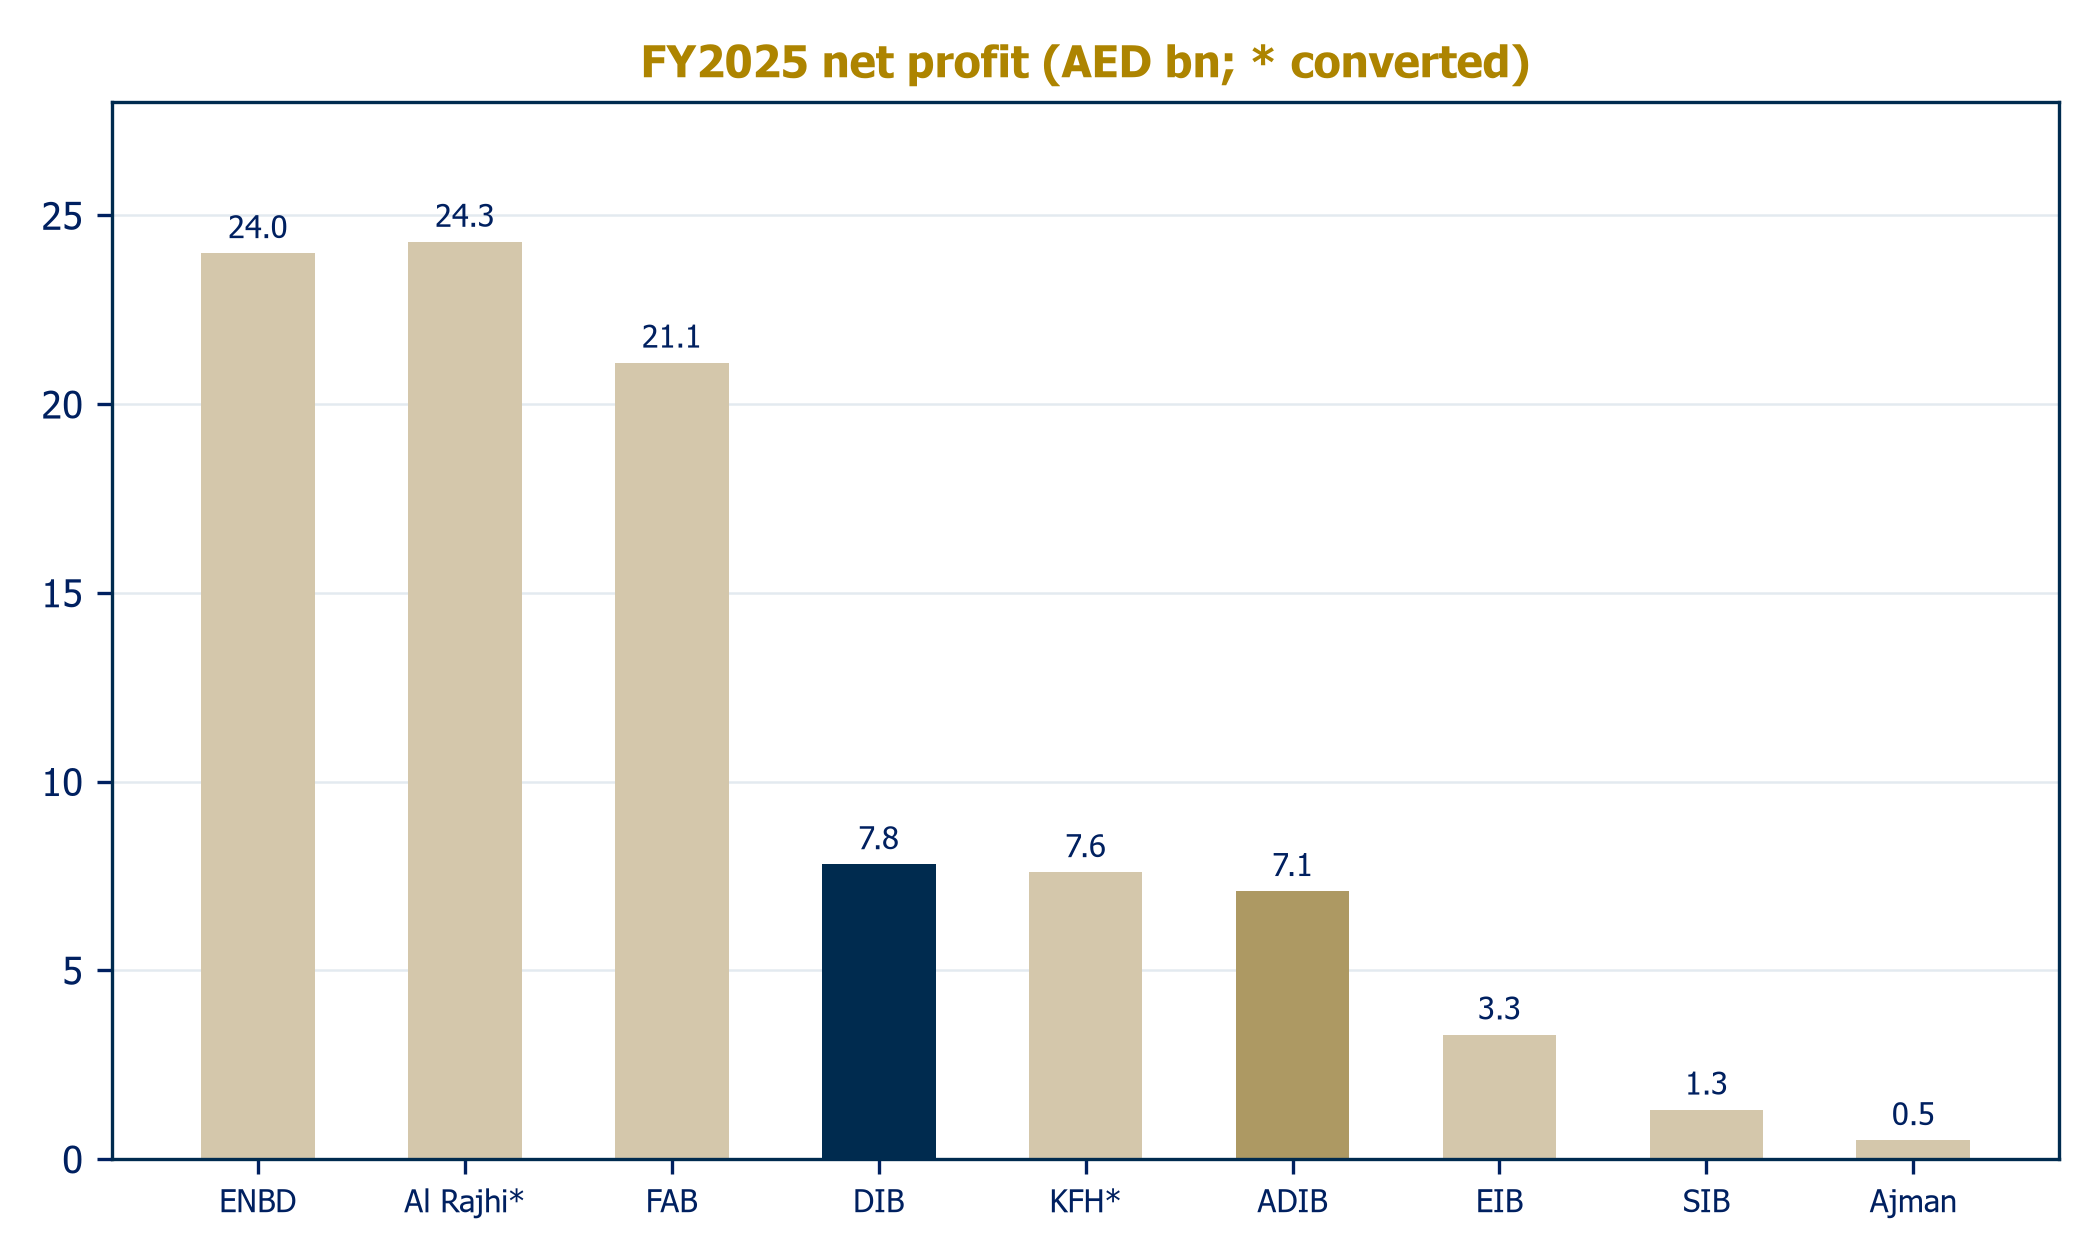
| Bank | Assets (bn) | FY25 profit | ROE | P/E (x) | P/B (x) |
| DIB (UAE) | AED 416 | AED 7.8bn | 17.2% | 7.4 | 1.24 |
| ADIB (UAE) | AED 281 | AED 7.1bn | ~28% | 13.1 | 2.66 |
| Sharjah Islamic | AED 90 | AED 1.3bn | 16.3% | 7.2 | n.a. |
| Al Rajhi (KSA) | SAR 1,043 | SAR 24.8bn | 23.4% | 16.4 | ~3.7 |
| Emirates NBD | AED 1,000+ | AED 24.0bn | 18.8% | 8.2 | 1.23 |
| FAB (UAE) | AED 1,400 | AED 21.1bn | 19.2% | 10.6 | 1.51 |
First, the tax wedge made pre-tax delivery invisible. Shareholders eat after-tax earnings, and those have been flat for three halves. Second, the dividend cut broke the signal: cutting to 35 fils from 45 despite record pre-tax profit was prudent capital management ahead of 21% growth, but it read as a downgrade of shareholder priority. Third, the returns math genuinely softened: heavy retention plus margin compression plus full taxation grinds post-tax ROTE from 17% toward 12-13%, and the market's P/B machine is brutal about that: our peer scatter shows GCC banks priced almost exactly on the justified-P/B line.
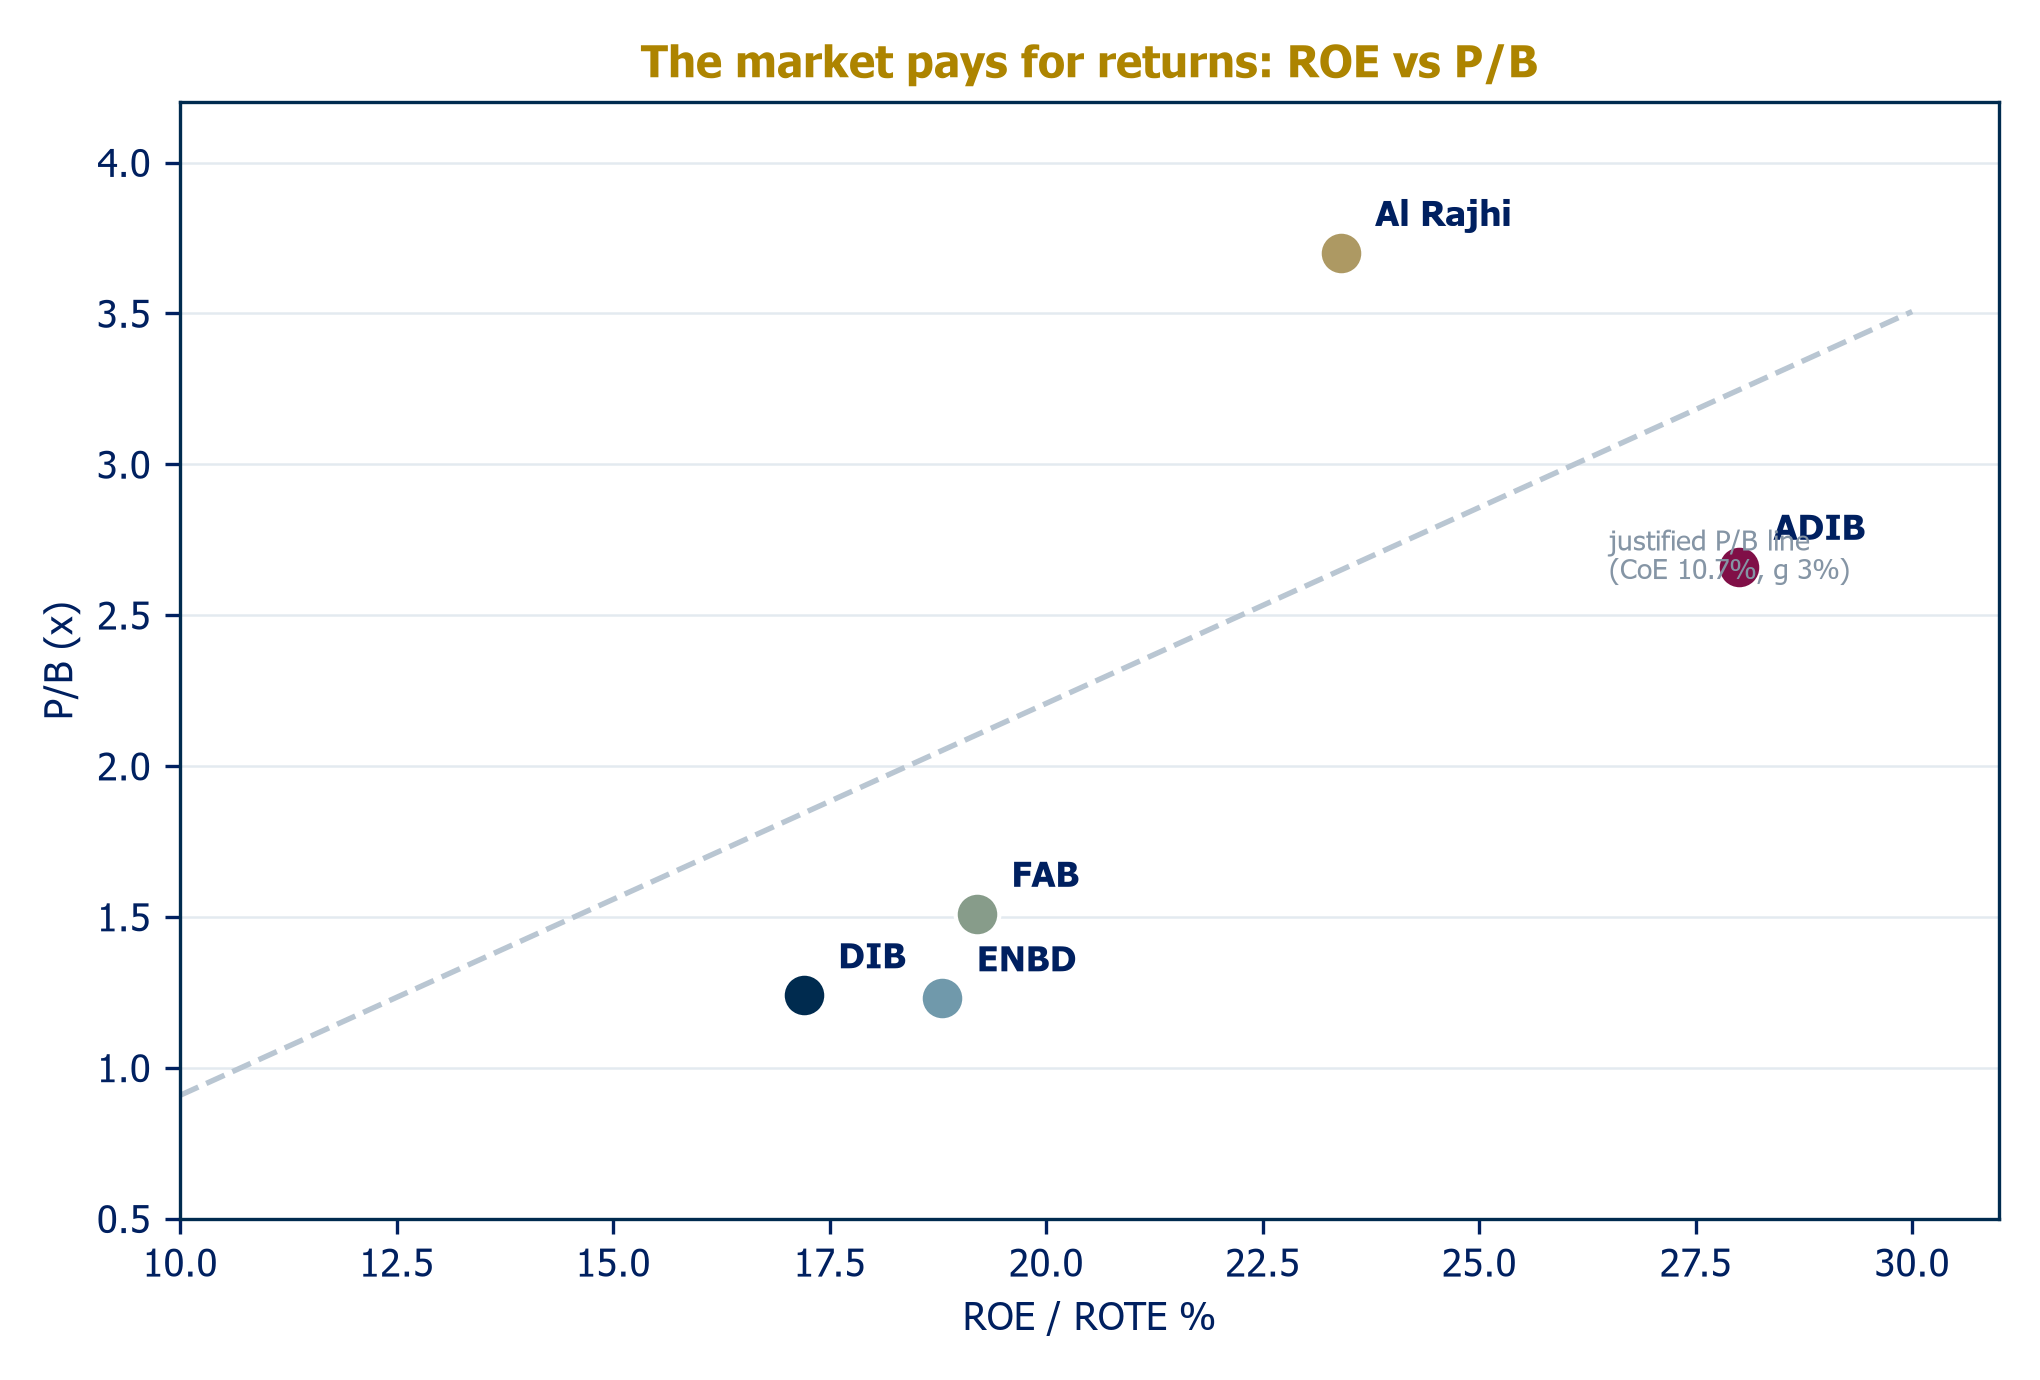
Three things. The franchise premium is being priced at zero: the largest bank in the segment with the strongest policy tailwind in global Islamic finance trades on a multiple matching Sharjah Islamic Bank's. The capital rebuild is done: the June 2026 AT1 took CET1 back to 13.0%, removing the equity-raise tail risk. The payout lever is live: as growth moderates toward our 7-8% forecast, the same logic that cut the dividend argues for normalization, and our DDM shows each ten points of payout is worth roughly half a dirham of fair value.
We would upgrade on evidence of any of: a stated payout policy or a return toward 45 fils; two consecutive quarters of NPM at or above the 2.3% floor; ROTE stabilization in disclosure and delivery; or balance-sheet growth converting into fee franchises that lift returns without capital. Symmetrically, the bear path is margin overshoot below 2.1% or a Dubai property correction. At 1.0x book, we think the market has already paid for the bear case; it has not yet paid for management pulling any lever at all.
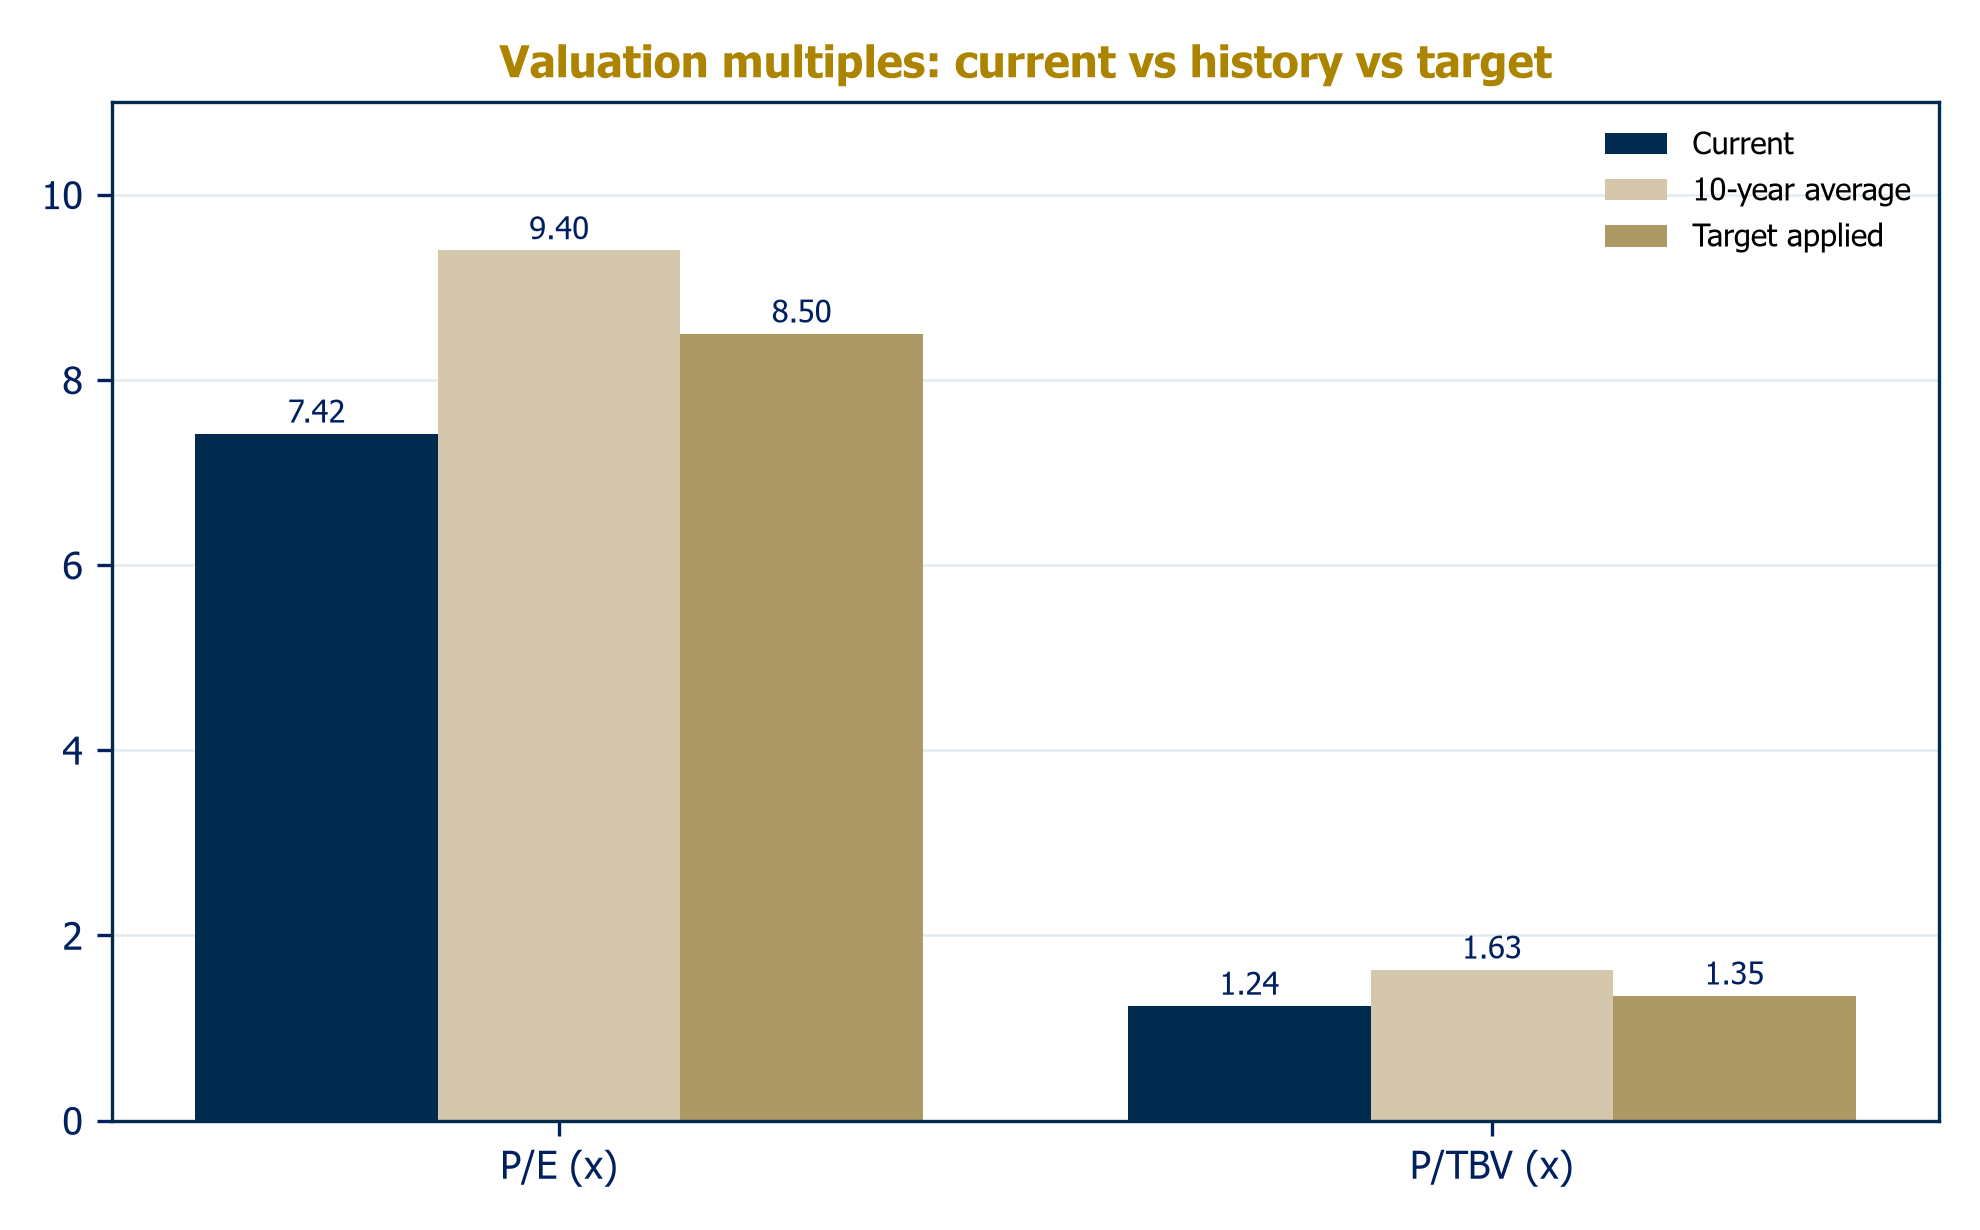
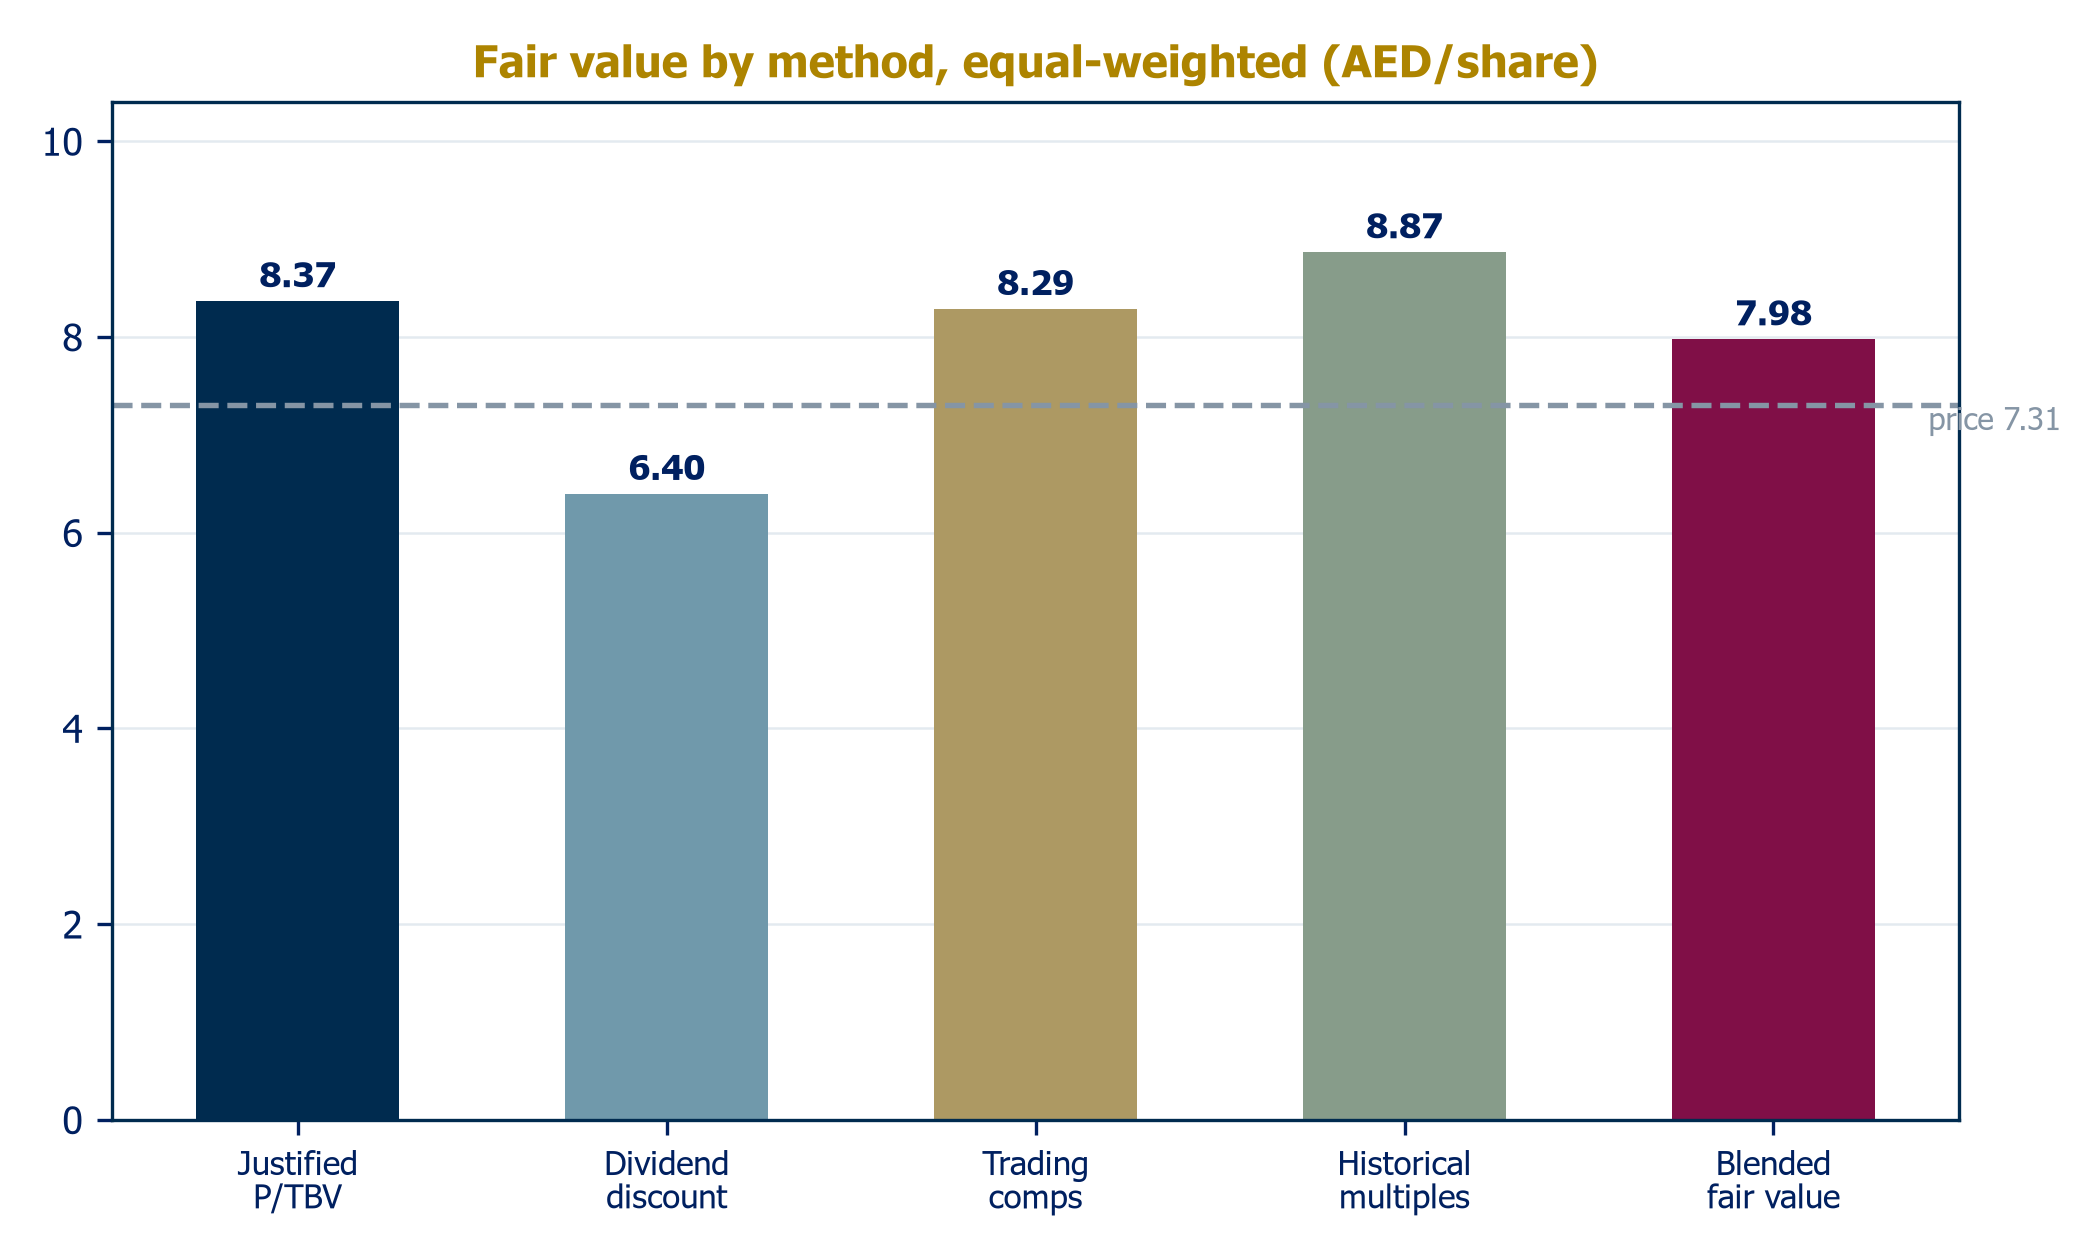
We value DIB with four equity-side methods, equally weighted. Enterprise-value approaches built on unlevered free cash flow do not apply to a deposit-funded bank. The blend gives a fair value of AED 7.98, 9.2% above the last close, and an Equal-Weight initiation under the house rule of plus-or-minus 15%.
| Method | Implied value (AED) | Weight | Contribution |
| Justified P/TBV (Gordon on ROTE) | 8.37 | 25% | 2.09 |
| Dividend discount model | 6.40 | 25% | 1.60 |
| Trading comparables | 8.29 | 25% | 2.07 |
| Historical multiples | 8.87 | 25% | 2.22 |
| Blended fair value | 7.98 | 100% | 7.98 |
Risk-free rate 4.0% (10-year US Treasury, the relevant anchor under the peg), equity risk premium 6.0%, beta 1.05, plus 40bps for regional and concentration factors, with terminal growth of 3.0%.
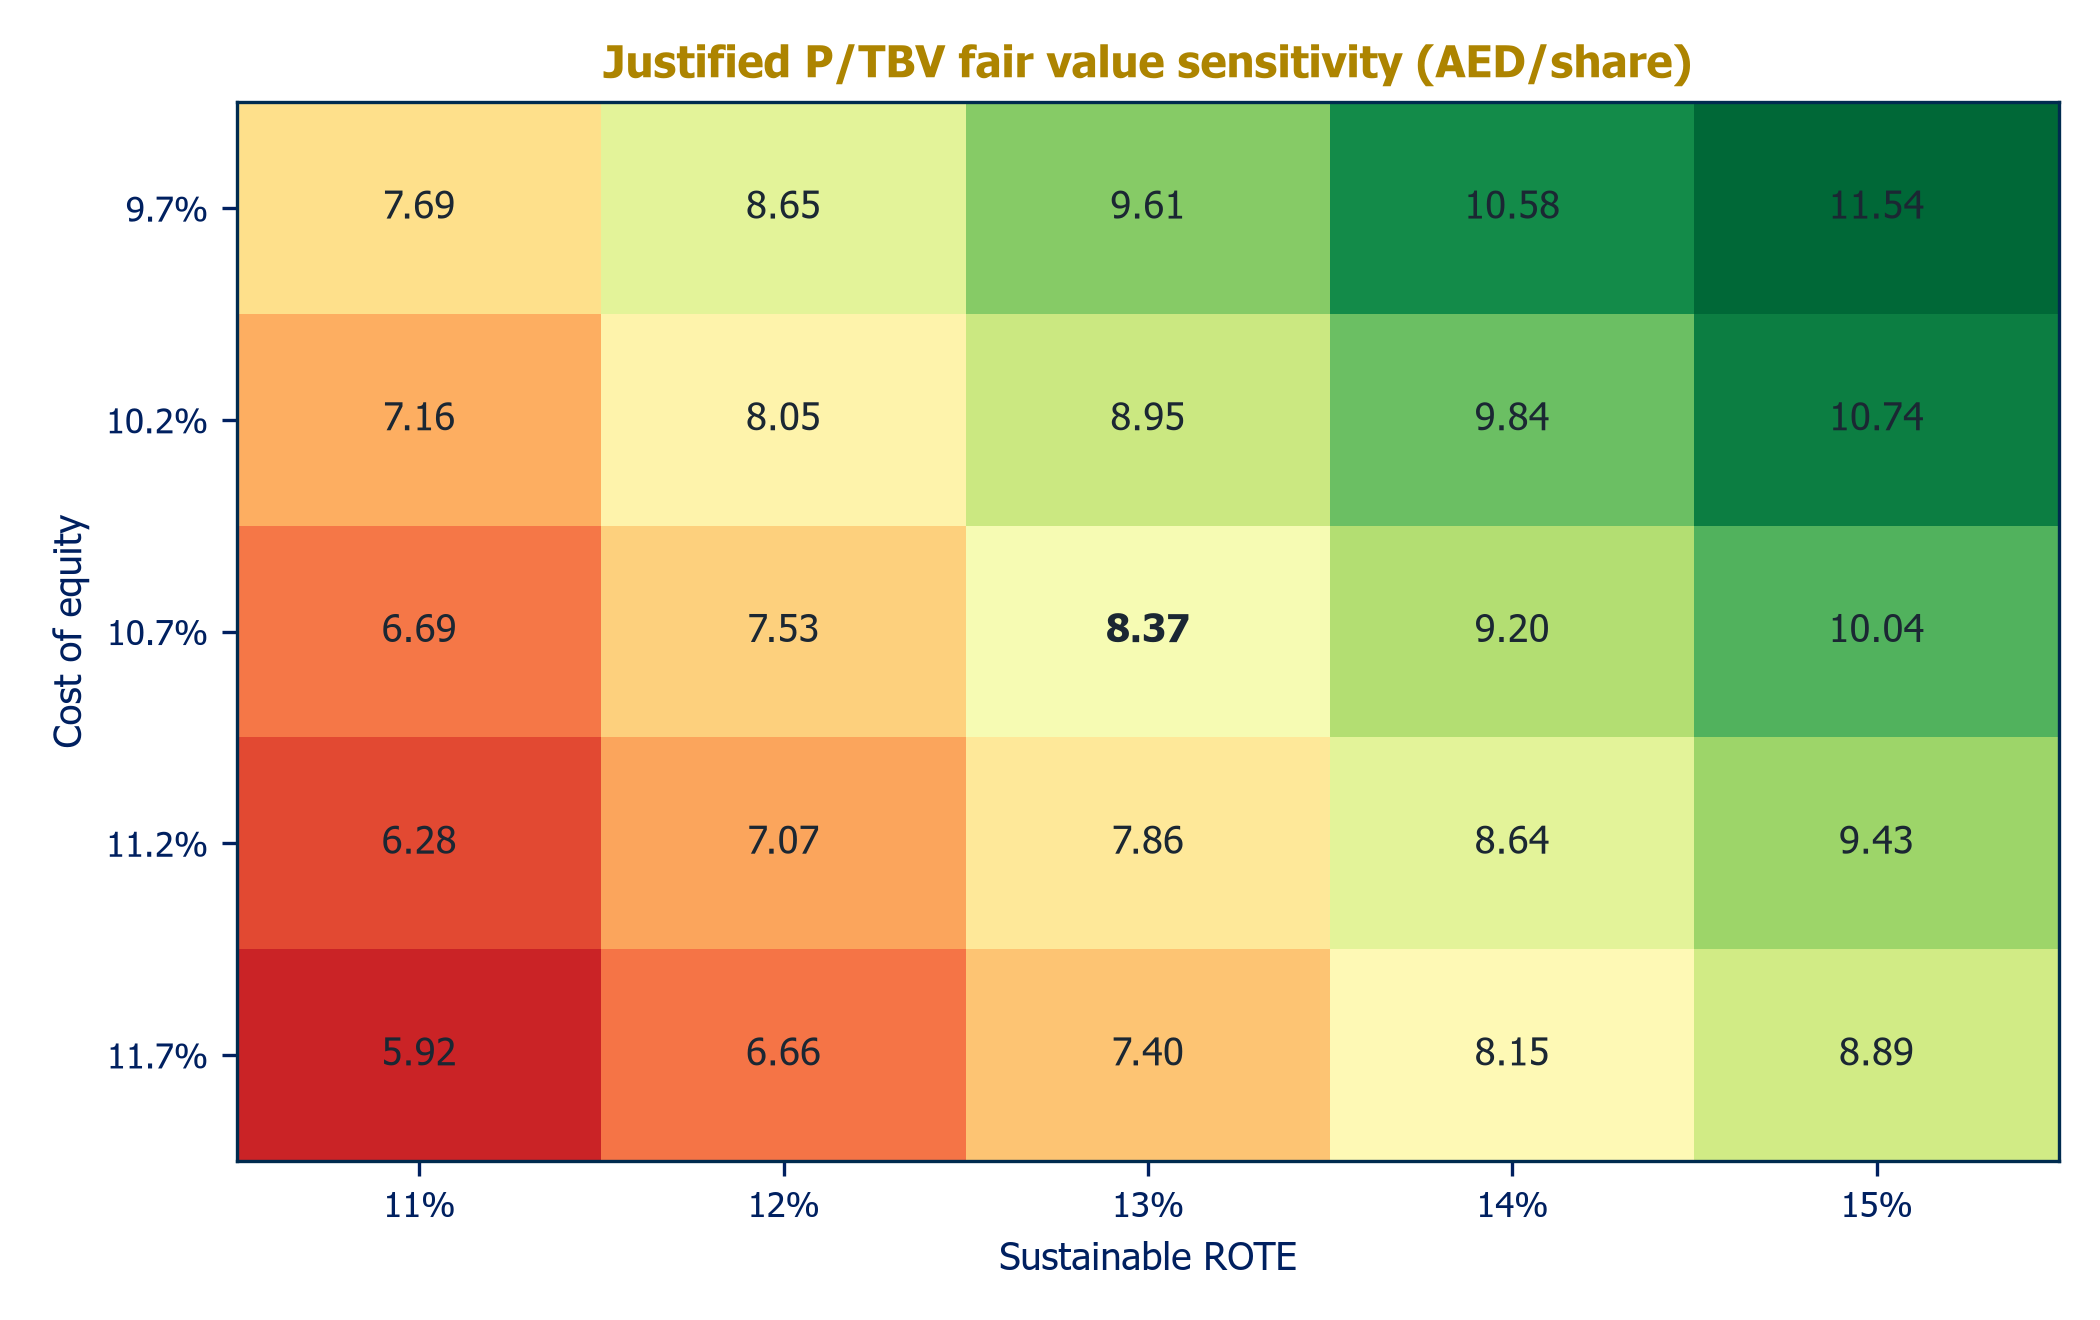
The Gordon formulation ties the warranted book multiple to sustainable returns. DIB earned about 17% post-tax ROTE in FY2025; our base case fades to 12-13% on heavy retention. We adopt 13.0%, between the two, implicitly assuming payout normalization restrains the equity build. That warrants 1.30x tangible book against 2026E TBVPS of AED 6.44. The grid is the debate in numbers: defend 15% ROTE and the stock is worth ten dirhams; accept the fade and today's price is roughly fair.
| CoE \\ ROTE | 11% | 12% | 13% | 14% | 15% |
| 9.7% | 7.69 | 8.65 | 9.61 | 10.57 | 11.53 |
| 10.2% | 7.16 | 8.05 | 8.94 | 9.84 | 10.73 |
| 10.7% | 6.69 | 7.53 | 8.37 | 9.20 | 10.04 |
| 11.2% | 6.28 | 7.07 | 7.85 | 8.64 | 9.42 |
| 11.7% | 5.92 | 6.66 | 7.40 | 8.14 | 8.88 |
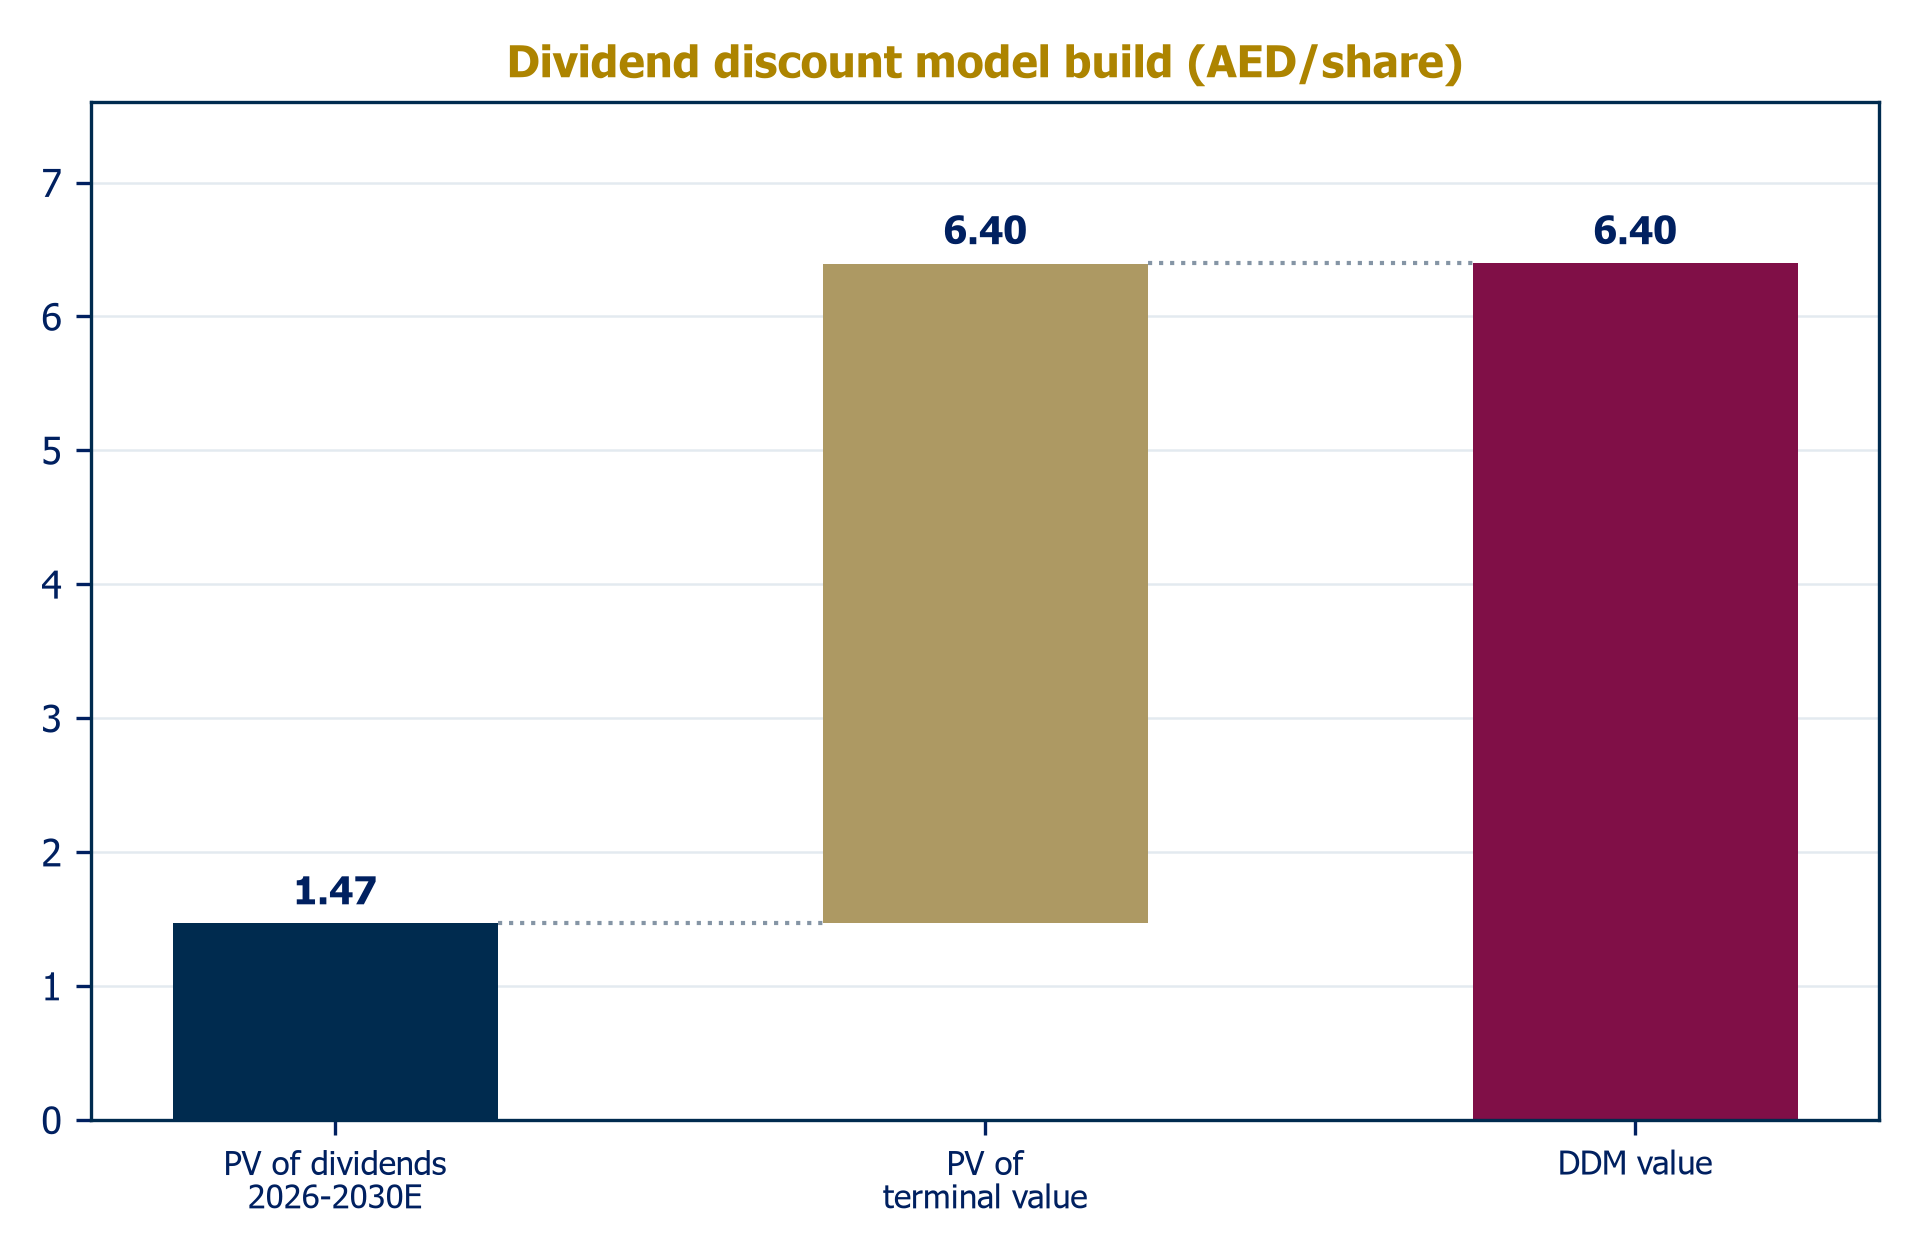
Discounting the base-case dividend path (35 to 45 fils, 2026-2030) at 10.7% gives AED 1.47 of present value; a terminal value on a normalized 60% payout of 2031 earnings adds AED 4.92. The DDM prices only the cash the base case actually pays, and its gap to the other methods is precisely the market's current complaint. Payout normalization from 2027 rather than the terminal year would lift this leg toward AED 7.5-8.0 on its own.
DIB trades at 7.4x trailing earnings, the cheapest of any large GCC Islamic or UAE conventional bank, and at 1.24x tangible book versus ADIB's 2.66x. We apply a target P/E of 8.5x 2026E EPS (premium to SIB and Ajman for scale, deep discount to ADIB for the returns gap) and a target P/TBV of 1.35x, averaging AED 8.29. Against DIB's own history (10-year P/E 9.4x retained; book anchor moderated to 1.40x for the post-tax era), the value is AED 8.87; the market paid these levels as recently as February 2026.
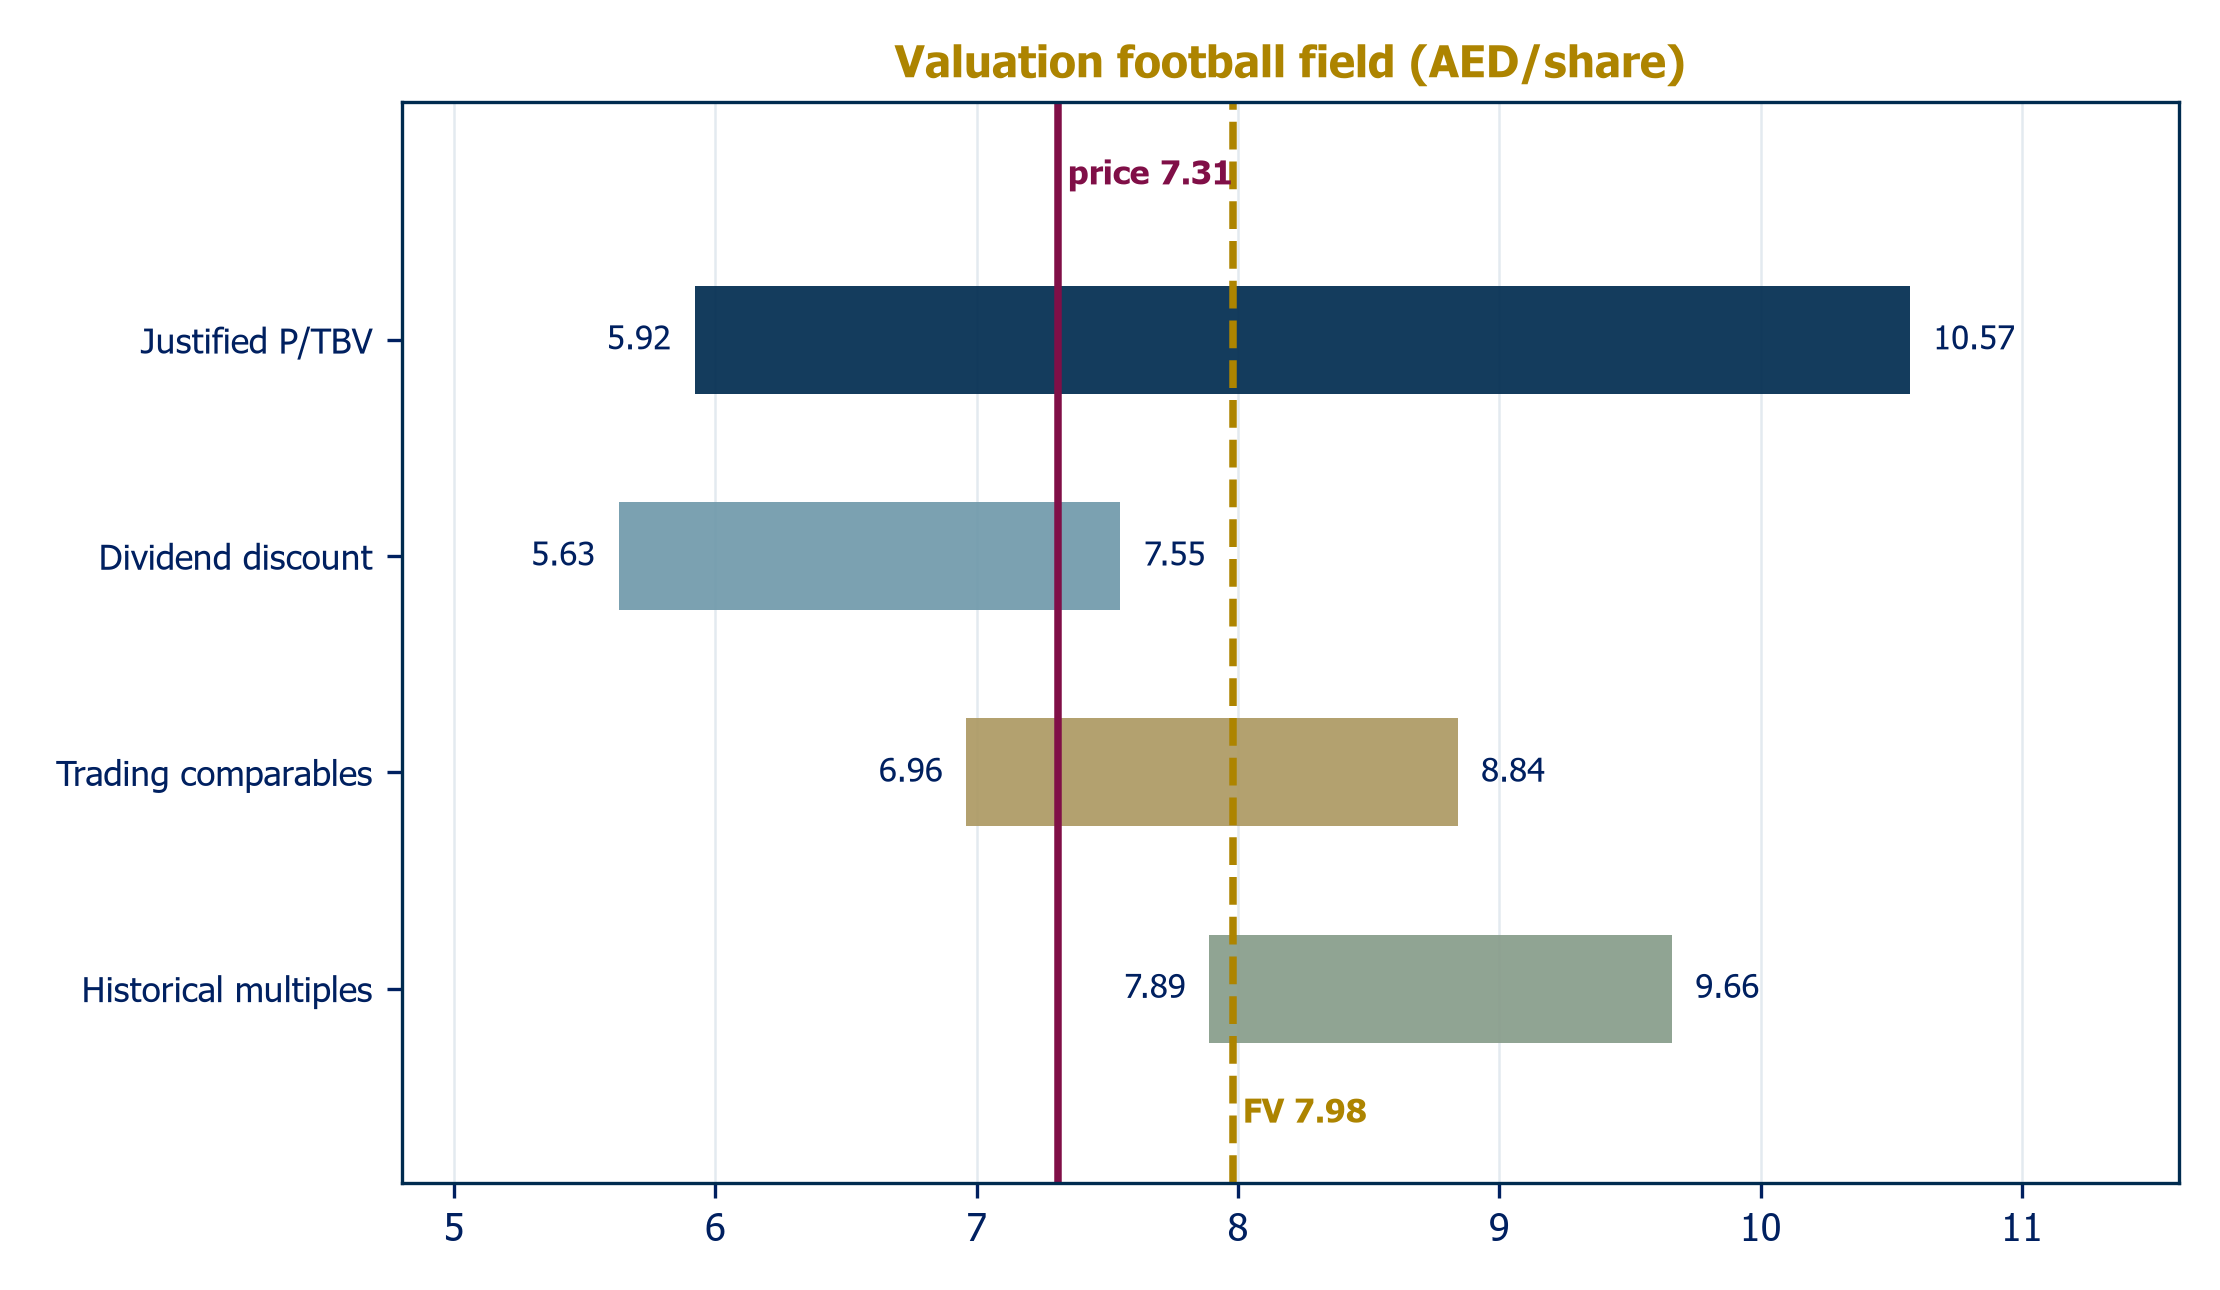
At AED 7.31 the stock trades at 1.13x 2026E tangible book; solving the Gordon relation backwards, the market is pricing a sustainable ROTE of about 11.7%, below even our deliberately conservative model trough of 12.3%. The current price embeds a returns fade slightly worse than a base case which assumes management pulls no lever at all. That gives the risk-reward its asymmetry despite a headline upside of only 9%: the bear case is largely in the price, while none of the identifiable levers are.
With +9.2% price upside and a 4.8% dividend yield, the total return case is respectable but short of our Over-Weight threshold, hence Equal-Weight, with a clear map of what changes the answer. Catalysts: (1) H2 2026 results proving the 2.3% NPM floor; (2) any payout normalization signal; (3) the end of the Fed cutting cycle giving 2027 margin visibility; (4) execution under the UAE's 2031 Islamic finance strategy; (5) continued record-tight sukuk pricing.
We believe the operating environment for UAE banking remains fundamentally supportive, but the picture could swing on global rates and regional geopolitics, and DIB carries specific exposures of its own.
| Risk | Category | Assessment |
| Margin compression beyond the 2.3% guided floor | Company | Each 10bps of NPM is ~AED 400m of revenue |
| Dubai real estate cycle and collateral linkage | Company | H1-26 values -16% YoY; NPF 2.4%, coverage 158% cushion |
| Capital headroom vs growth (CET1 13.0%) | Company | Two AT1 taps since 2024; hyper-growth would force choices |
| Credit-cost normalization from 14bps to ~45bps | Financial | Modeled; consensus assuming 2025 costs persist is too high |
| Tax and payout suppress the equity story | Financial | The de-rating driver and, symmetrically, the upside lever |
| Key person: thirteen-year CEO tenure | Company | Succession untested; a genuine event for the equity |
| Competitive intensity incl. digital challengers | Industry | Retail margin and deposit-cost pressure is structural |
| Sharia standardization shocks to sukuk docs | Industry | Low probability, high industry impact |
| Geopolitical escalation | Macro | S&P's stated 2026 downside; hits growth, property, multiples |
| US rate path tails | Macro | Faster cuts squeeze margins; no cuts prolong deposit costs |
| Income statement, AED m | 2023A | 2024A | 2025A | 2026E | 2027E | 2028E | 2029E | 2030E |
| Net funded income | 8,749 | 8,949 | 8,972 | 9,263 | 9,676 | 9,968 | 10,659 | 11,371 |
| Non-funded income | 2,916 | 3,887 | 4,279 | 4,161 | 4,076 | 4,197 | 4,401 | 4,613 |
| Net operating revenue | 11,665 | 12,837 | 13,251 | 13,424 | 13,752 | 14,165 | 15,060 | 15,984 |
| Operating expenses | (3,162) | (3,425) | (3,763) | (3,931) | (4,111) | (4,300) | (4,497) | (4,702) |
| Impairments | (1,396) | (407) | (485) | (826) | (1,205) | (1,424) | (1,426) | (1,415) |
| Profit before tax | 7,108 | 9,005 | 9,003 | 8,668 | 8,436 | 8,395 | 8,979 | 9,583 |
| Net profit | 7,010 | 8,165 | 7,808 | 7,454 | 7,170 | 7,136 | 7,632 | 8,145 |
| EPS (AED) | 0.88 | 1.04 | 0.98 | 0.93 | 0.89 | 0.89 | 0.95 | 1.02 |
| DPS (fils) | 45 | 45 | 35 | 35 | 38 | 40 | 42 | 45 |
| Balance sheet, AED m | 2023A | 2024A | 2025A | 2026E | 2027E | 2028E | 2029E | 2030E |
| Net financing assets | 199,453 | 212,427 | 262,055 | 288,261 | 314,204 | 339,340 | 364,791 | 390,326 |
| Sukuk investments | 68,172 | 82,161 | 90,589 | 90,589 | 96,024 | 101,785 | 107,893 | 114,366 |
| Total assets | 314,292 | 344,687 | 415,948 | 439,681 | 475,699 | 512,248 | 549,616 | 587,481 |
| Customer deposits | 222,054 | 248,546 | 320,184 | 339,396 | 368,244 | 397,704 | 427,531 | 457,459 |
| Total equity | 47,434 | 52,853 | 53,136 | 57,435 | 61,235 | 64,854 | 68,825 | 73,092 |
The information provided in this report has been prepared without taking account of your objectives, financial situation or needs. All observations, conclusions and opinions expressed reflect the personal views of the research analyst and are subject to change without notice. Information has been obtained from sources believed reliable; no warranty is made as to accuracy or completeness. Past performance is not an indication of future performance. [House disclaimer template: replace with the firm's compliance-approved text before any distribution.]
Ratings definitions. Over-Weight: fair value more than 15% above the market price. Equal-Weight: fair value within -15% to +15%. Under-Weight: fair value more than 15% below. Not Rated: no formal fair value or recommendation.